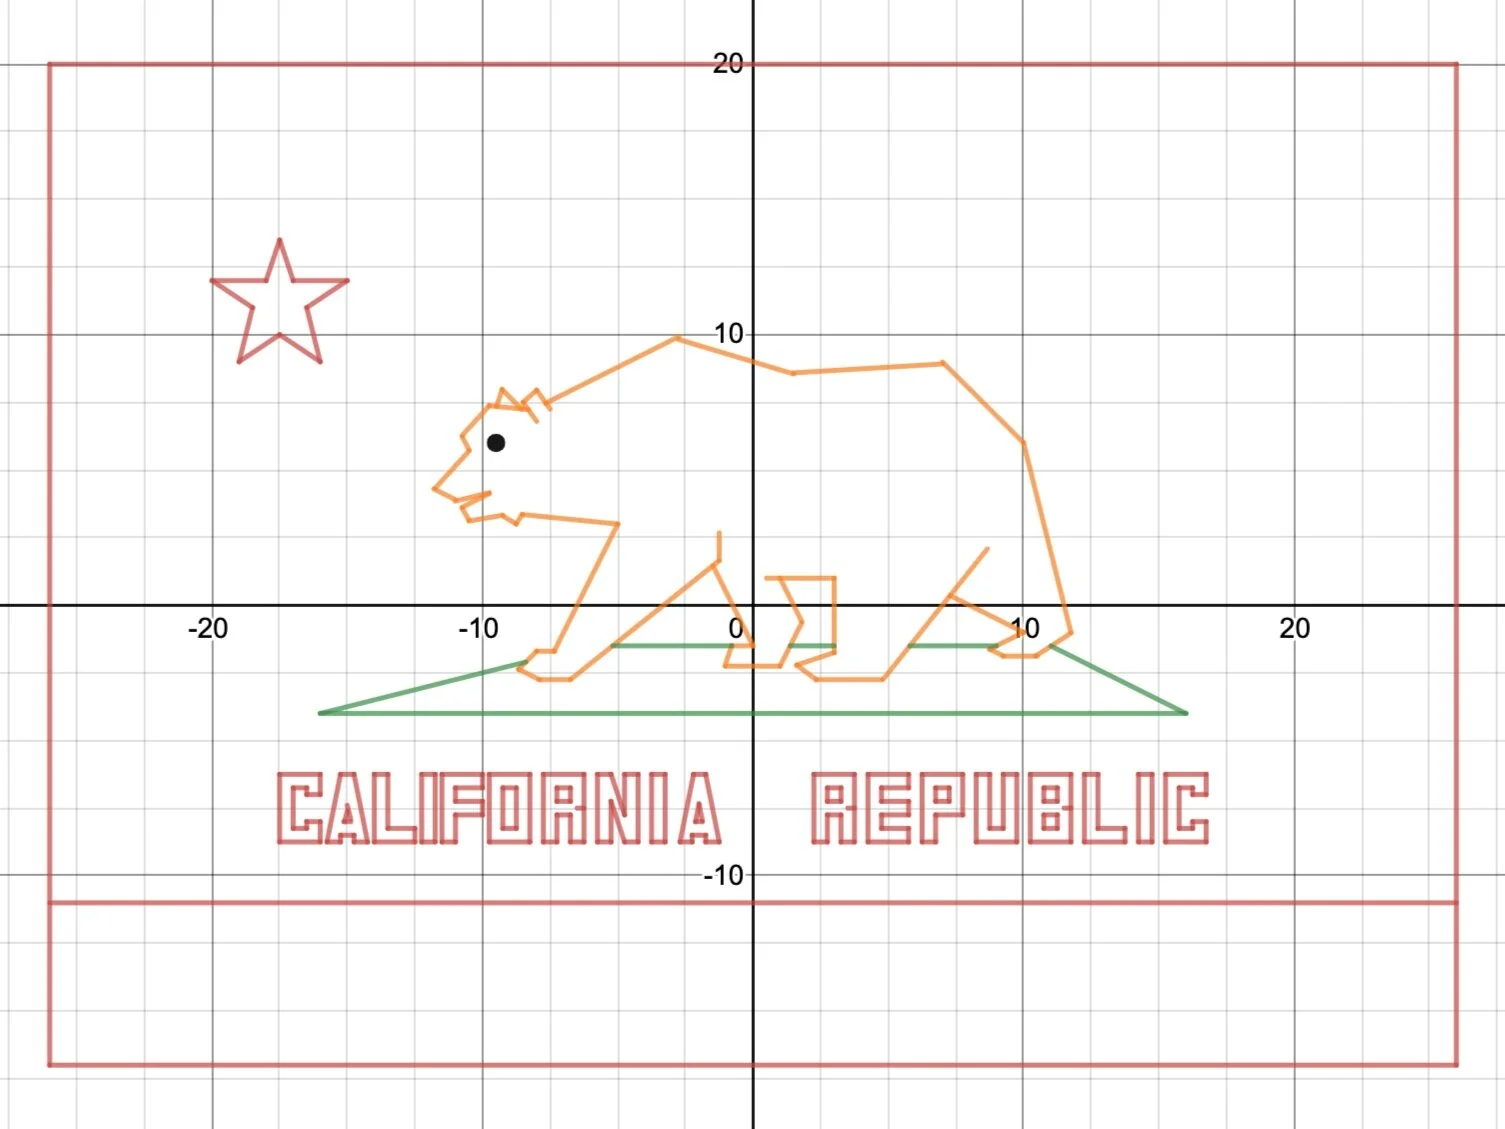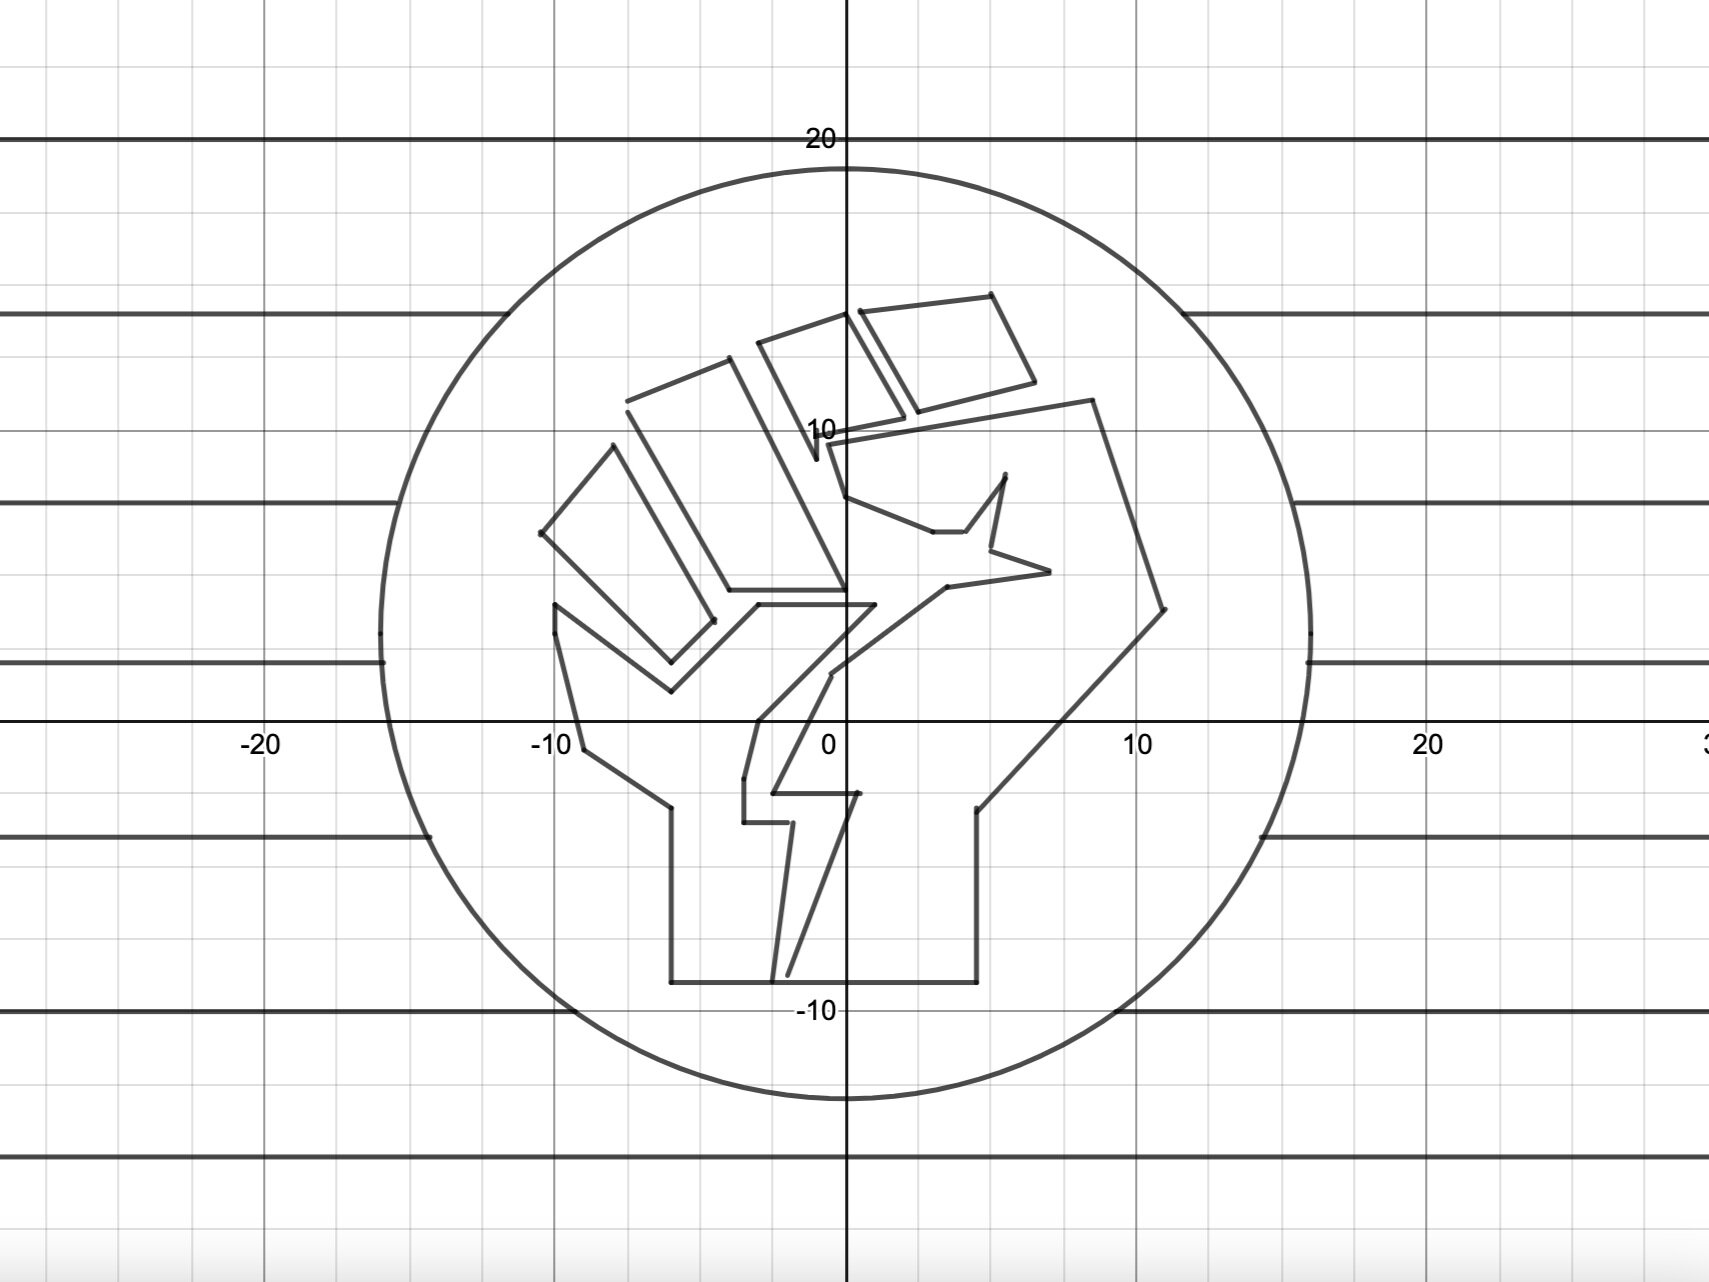
Graphing the Lines of Flags Project
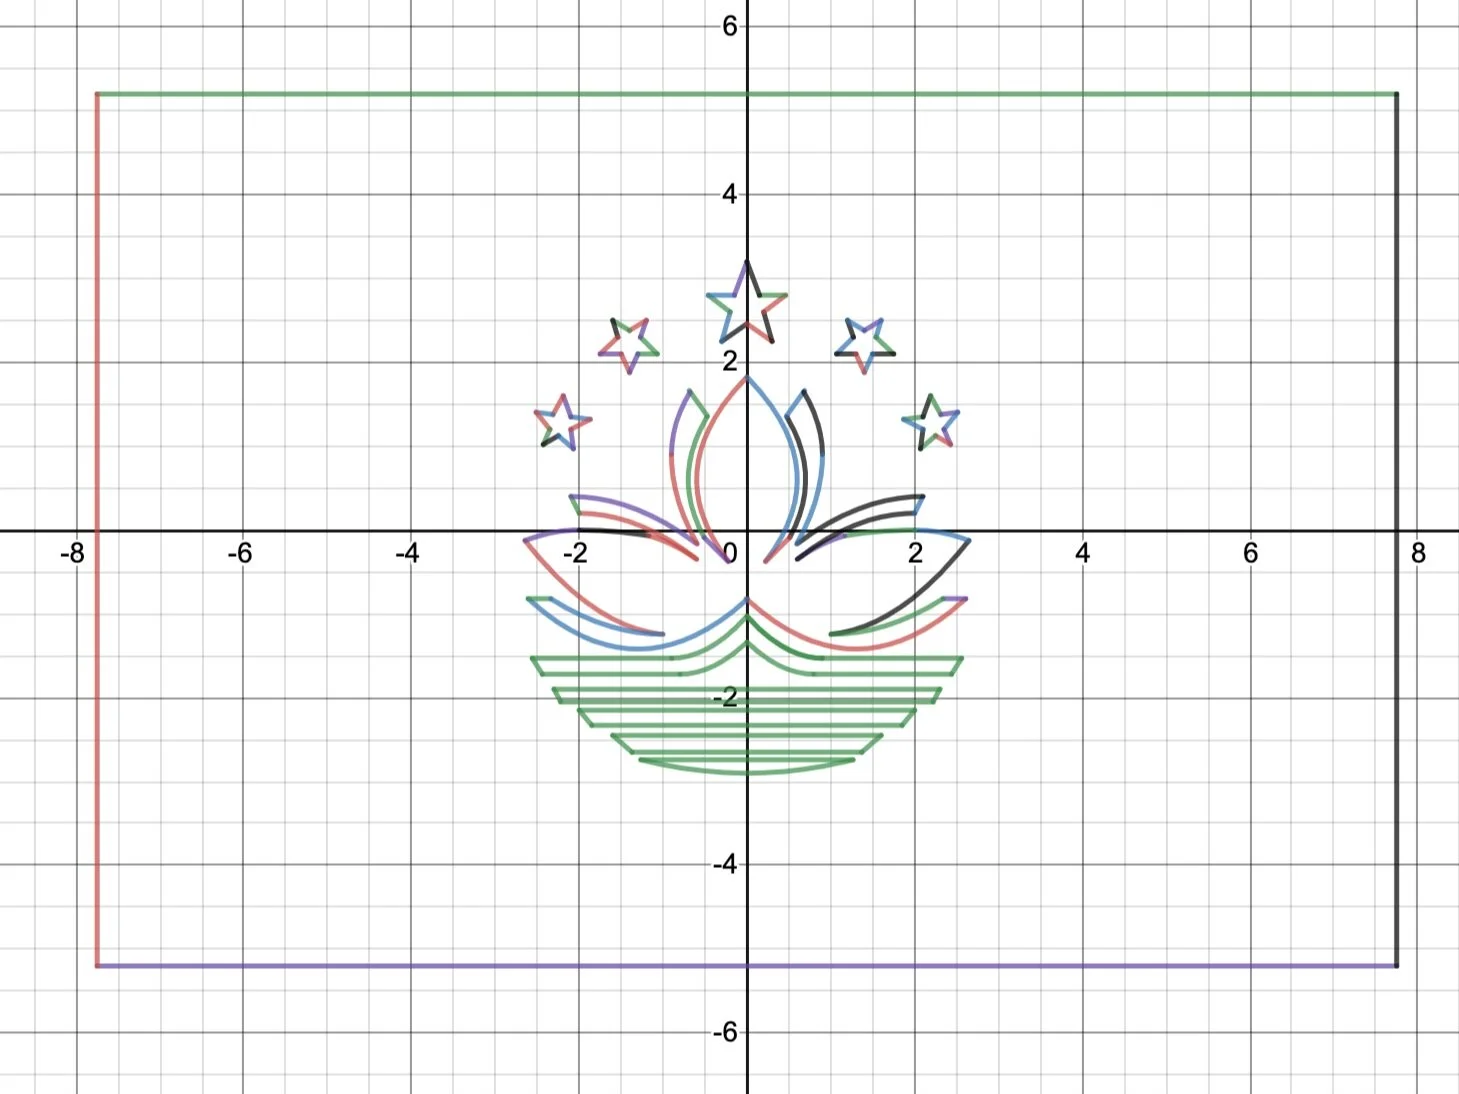
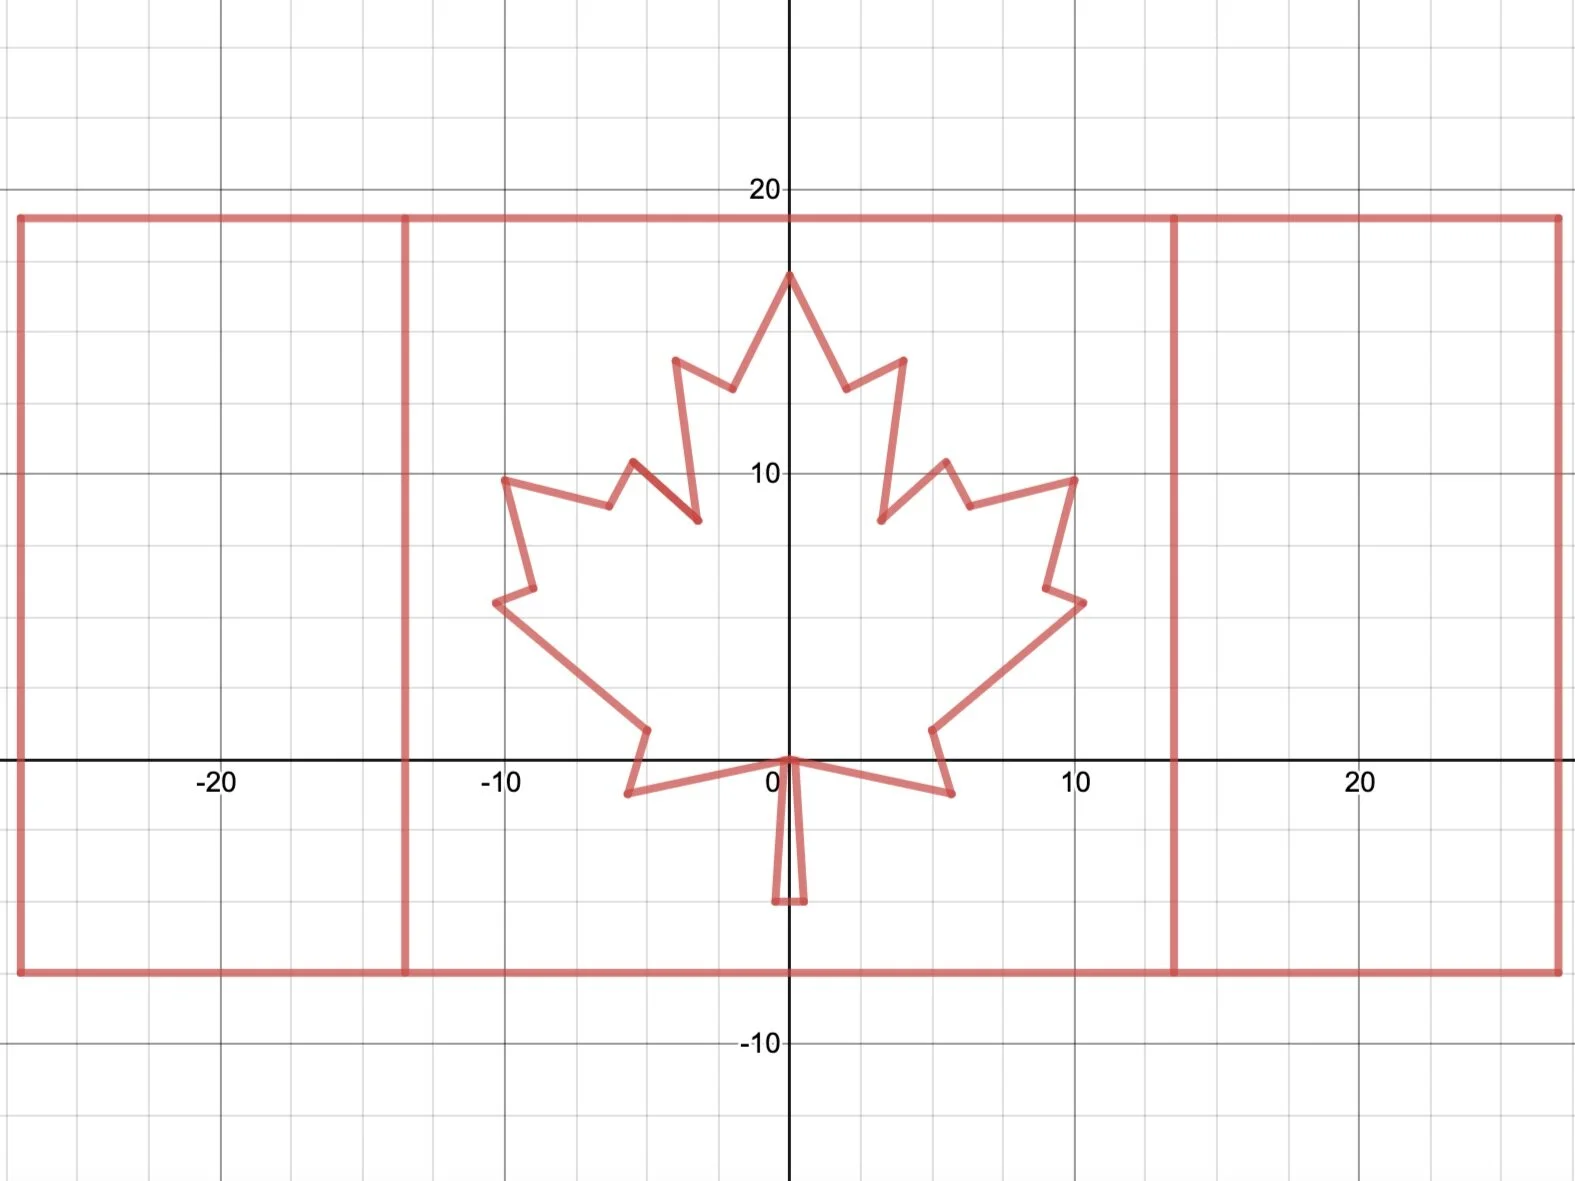
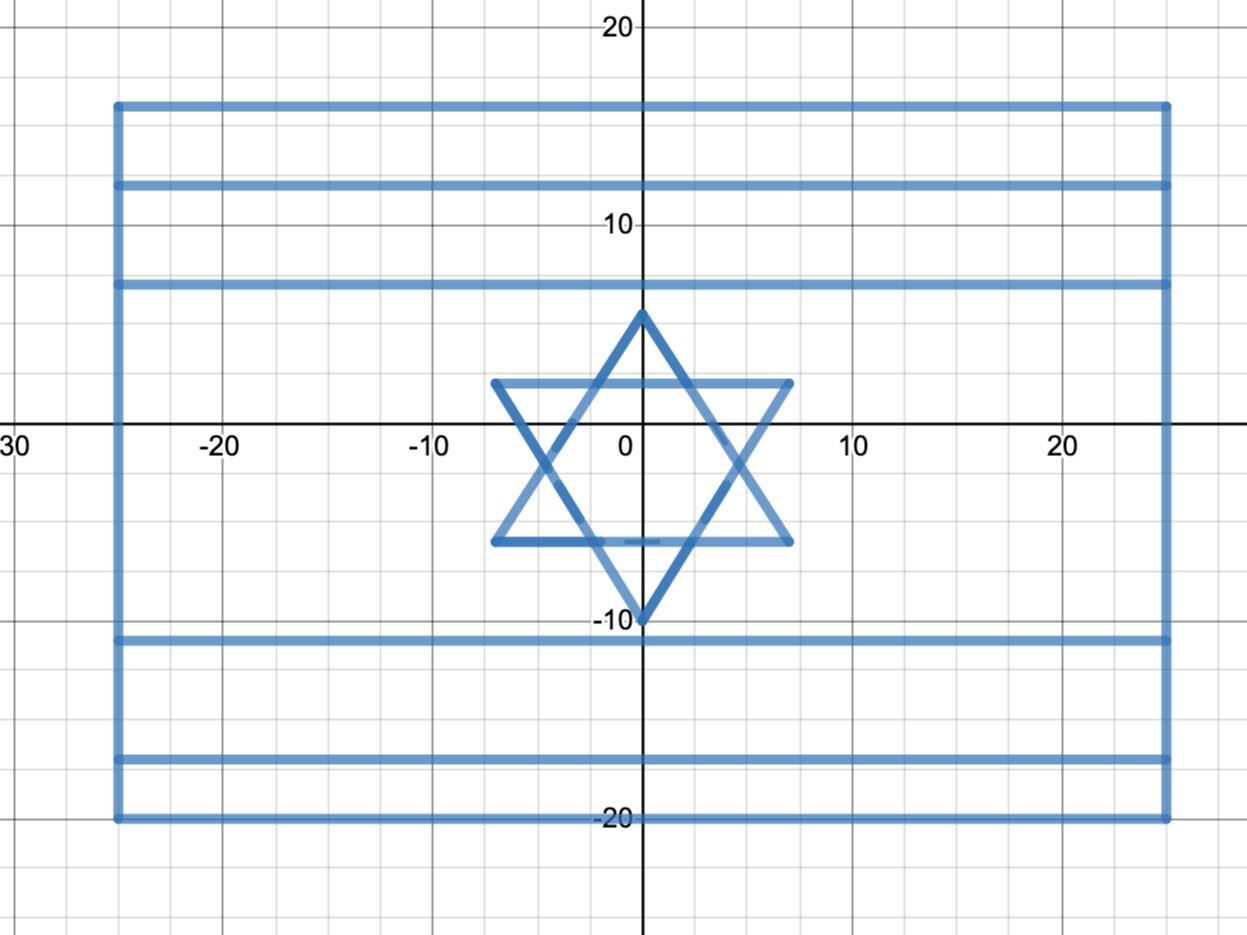
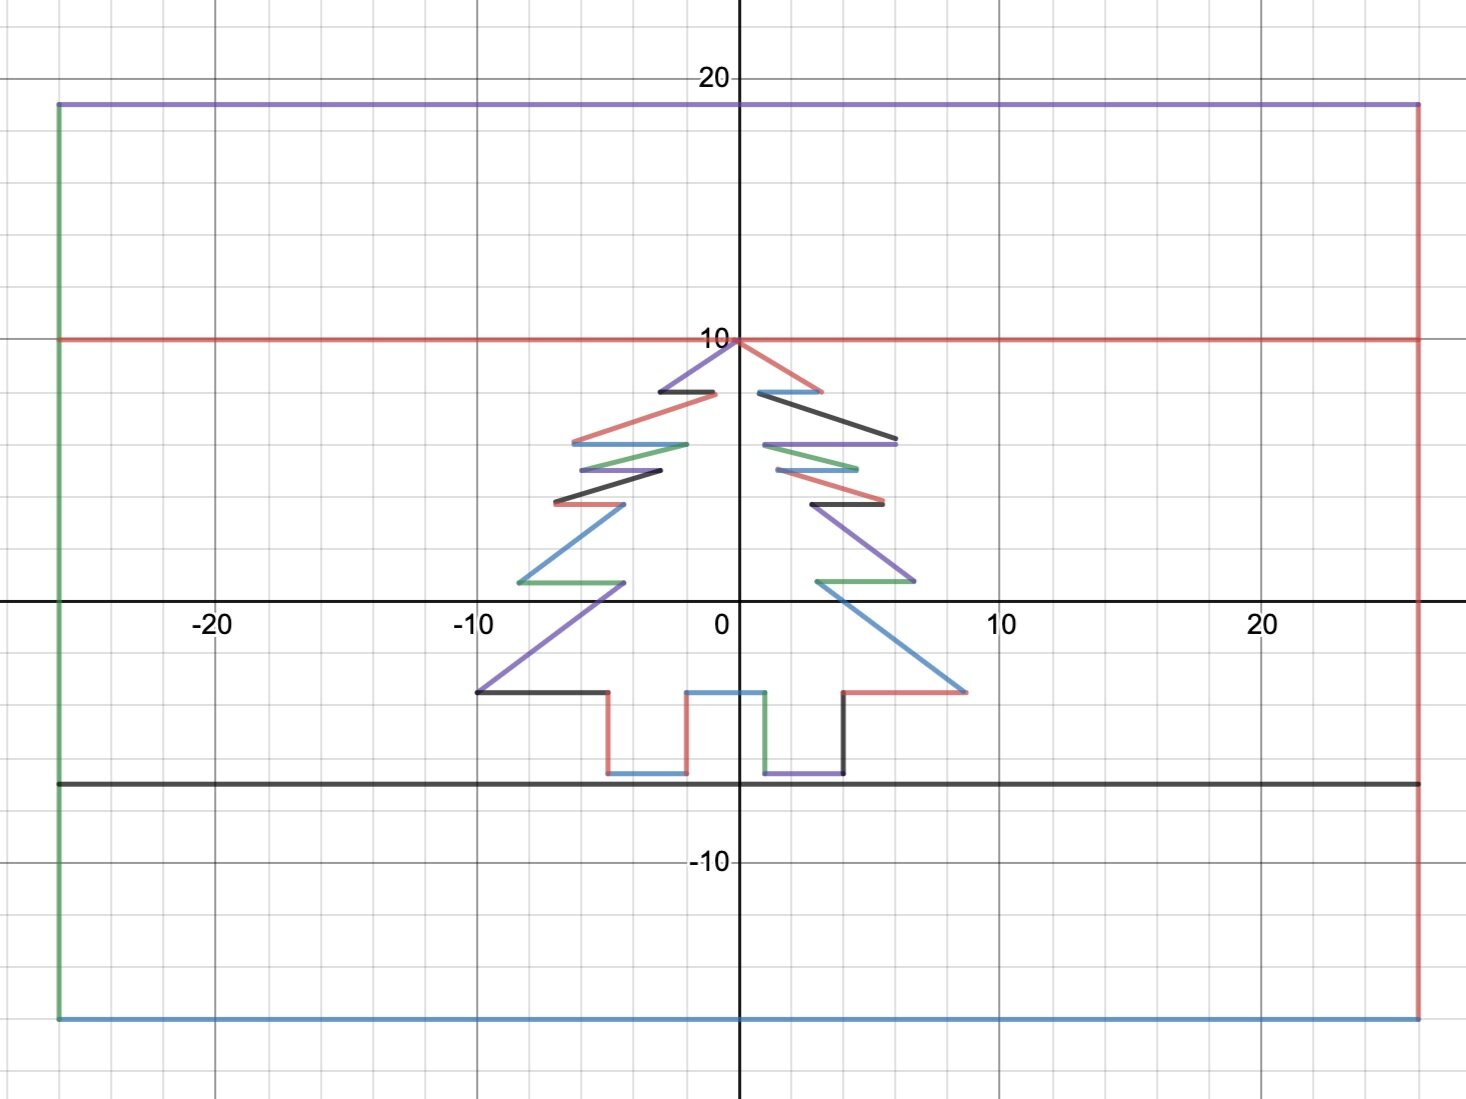
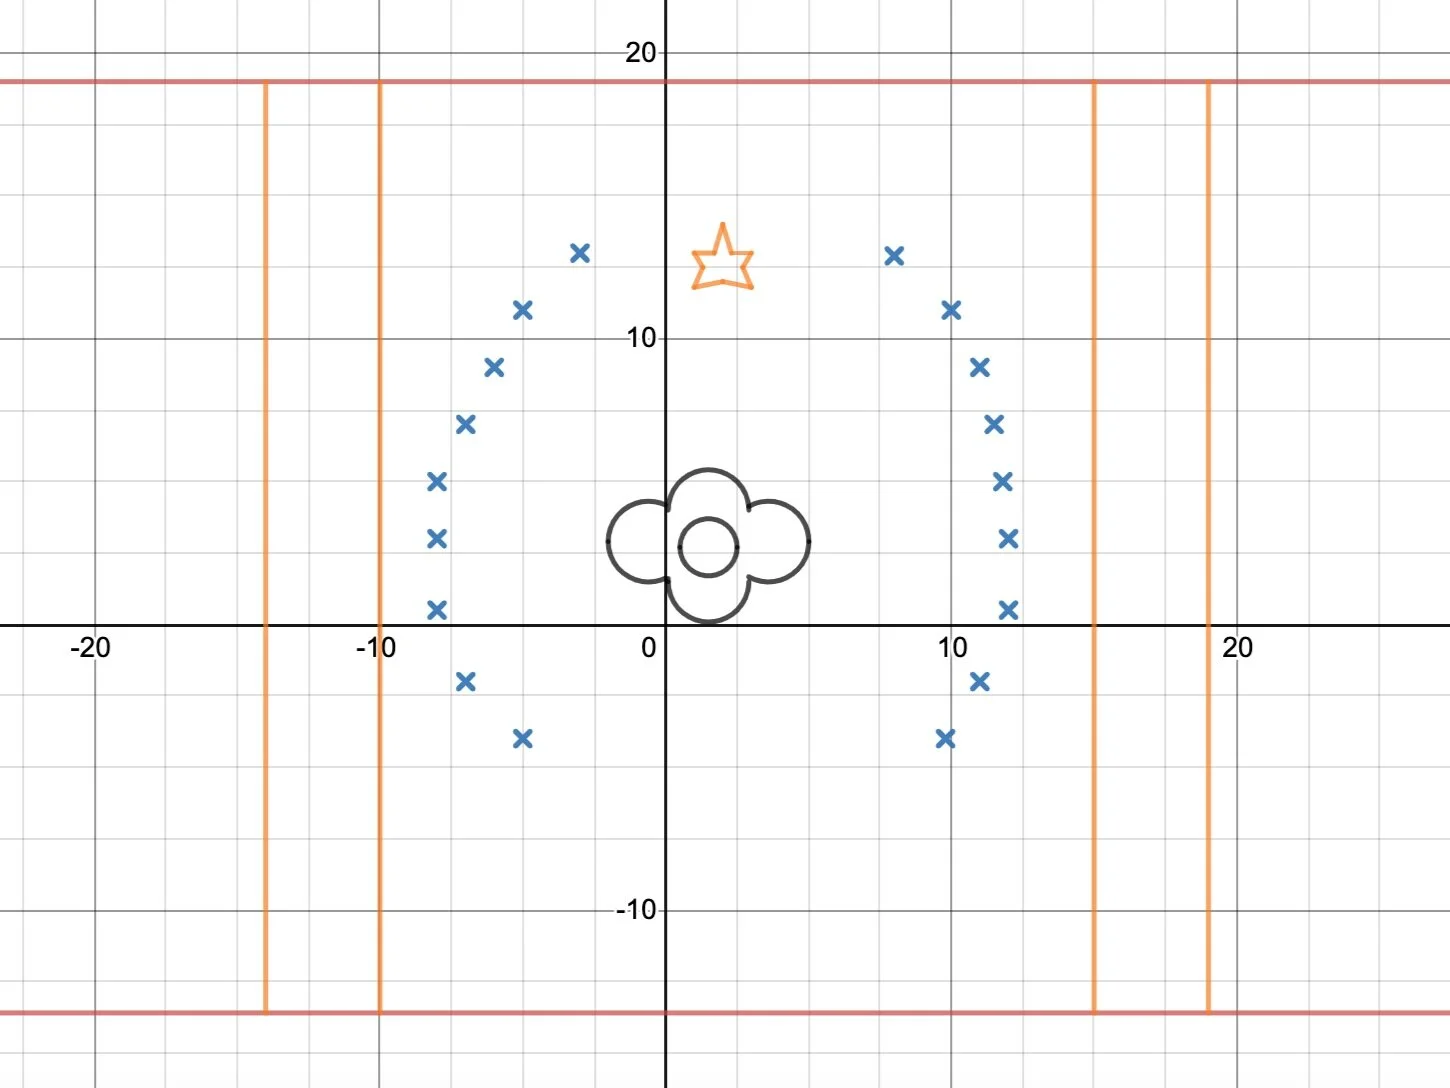
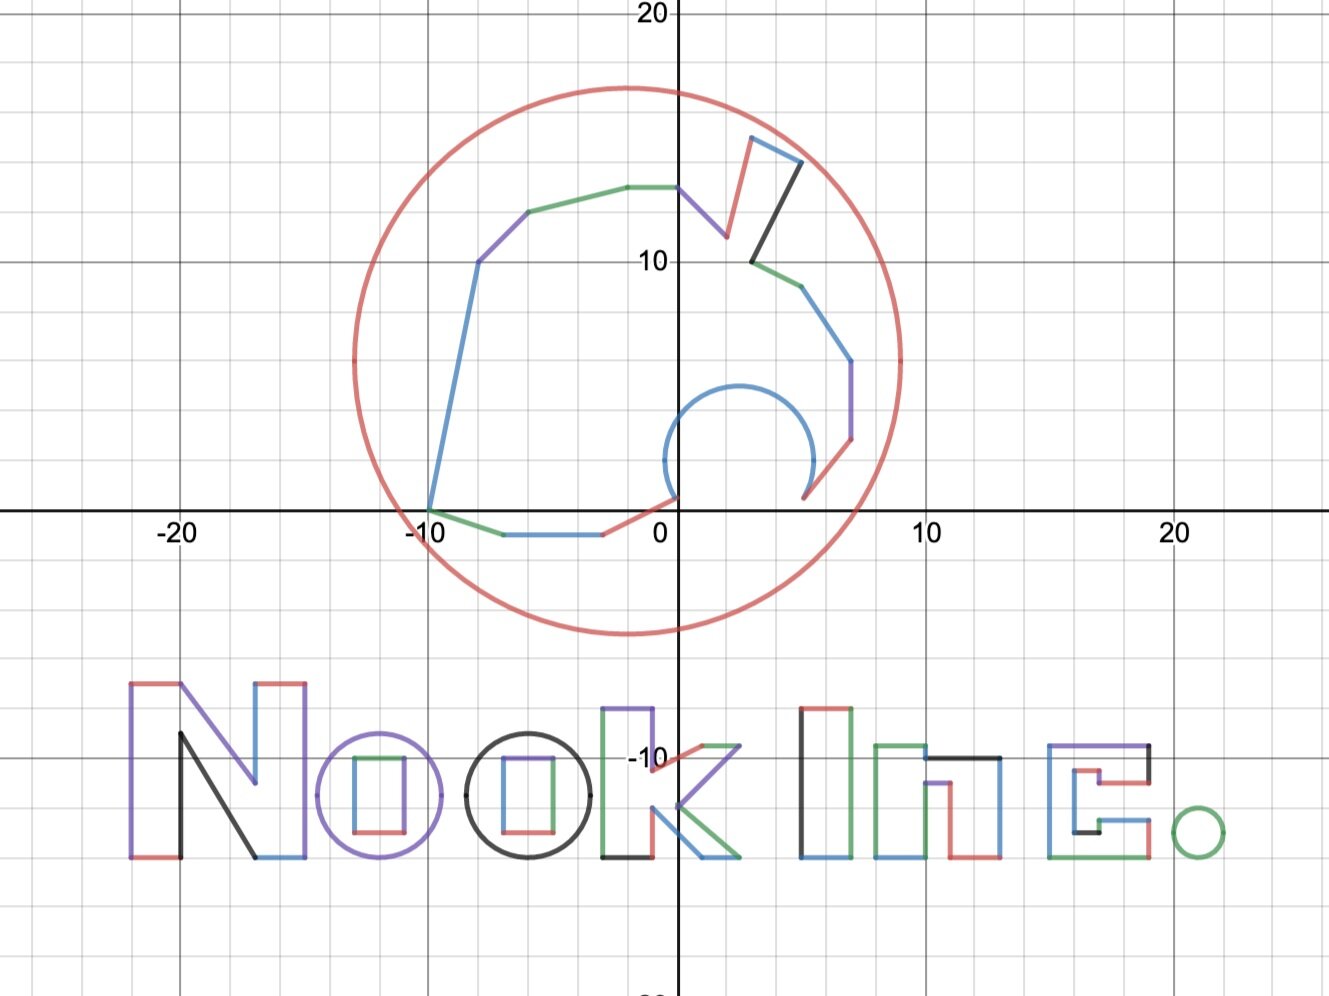
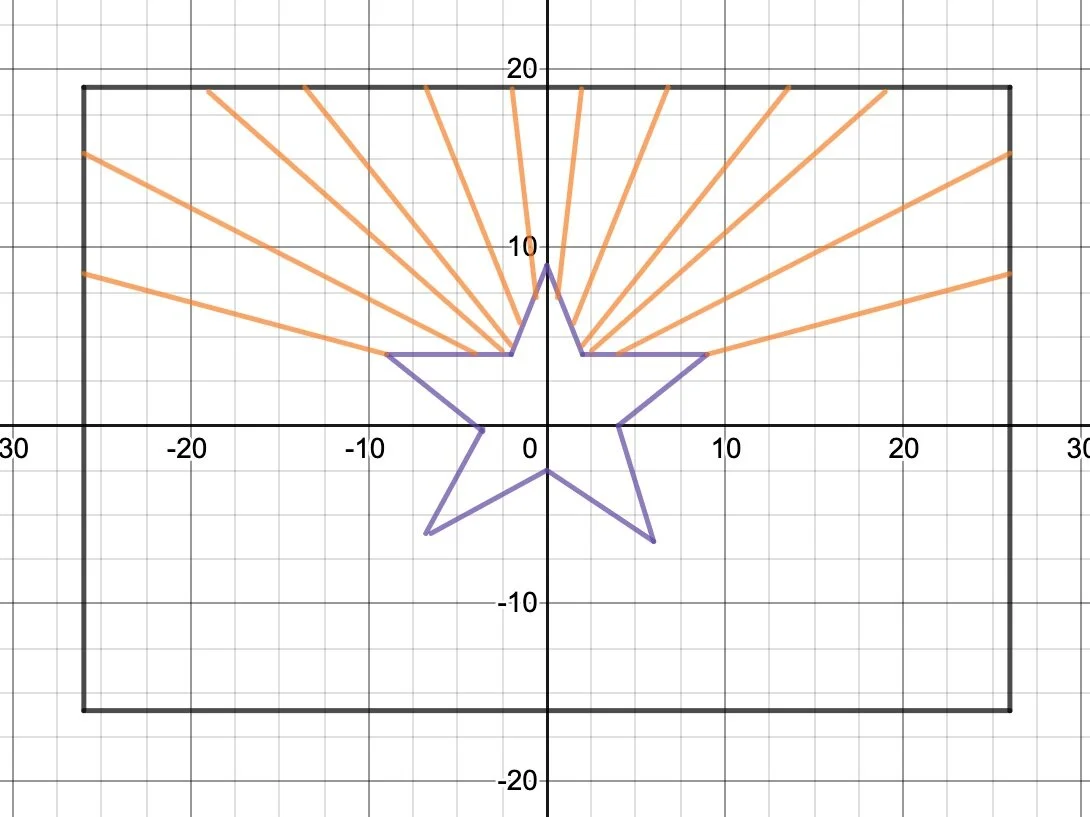
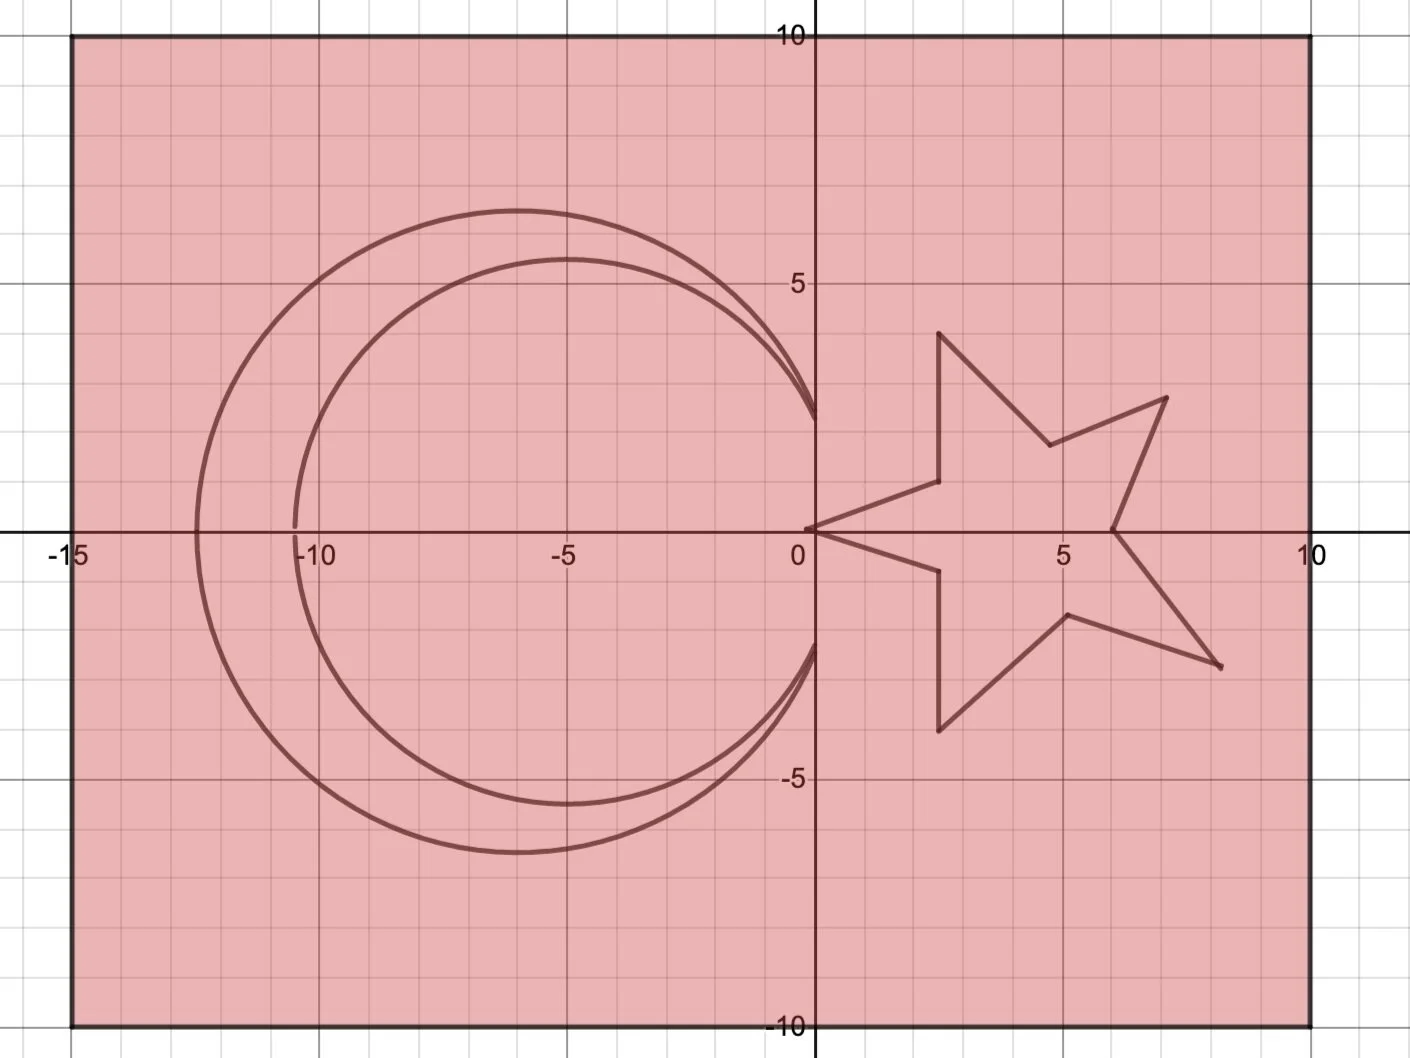
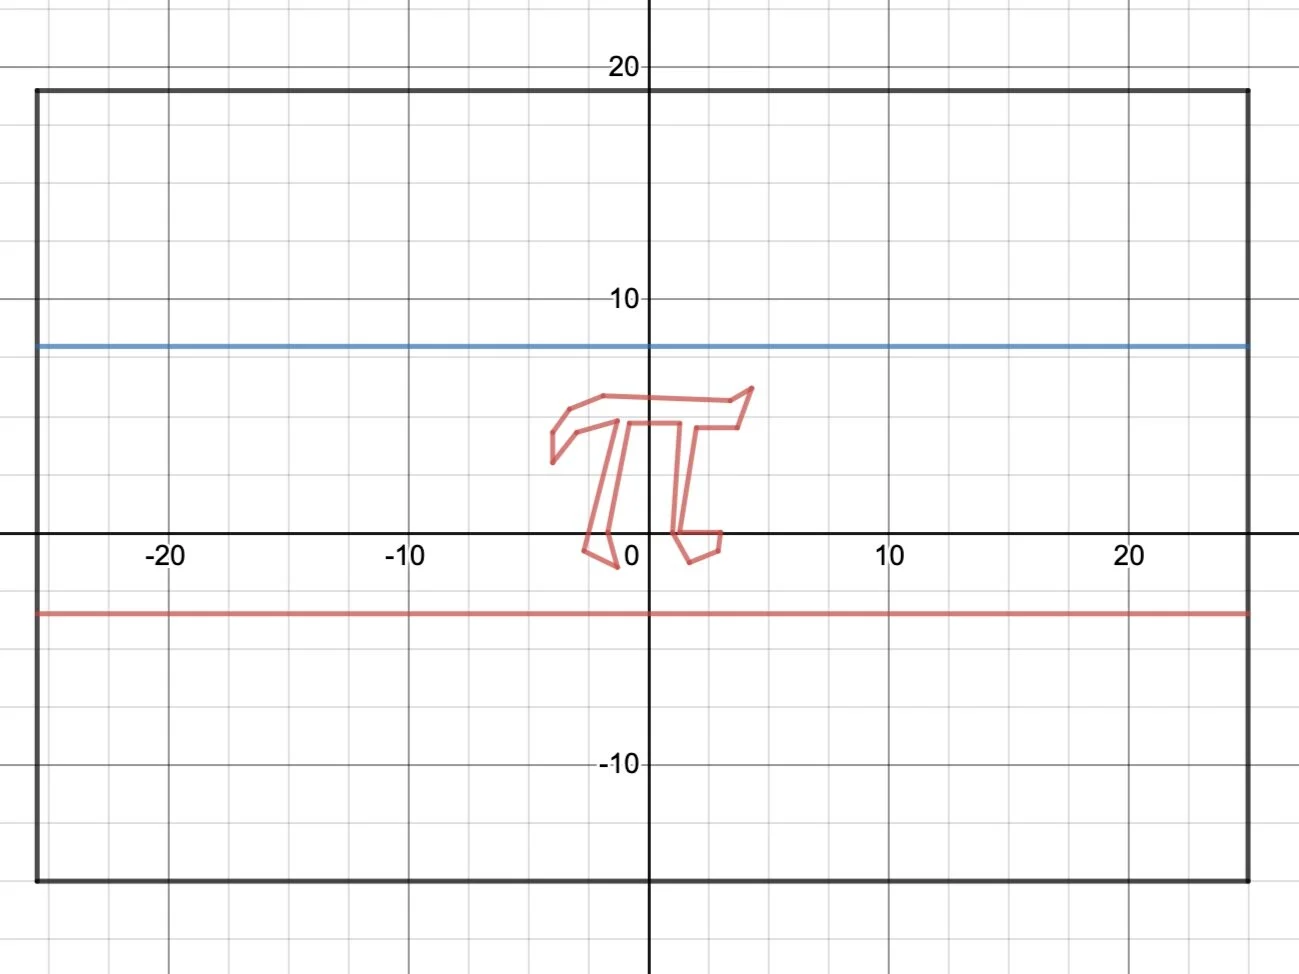
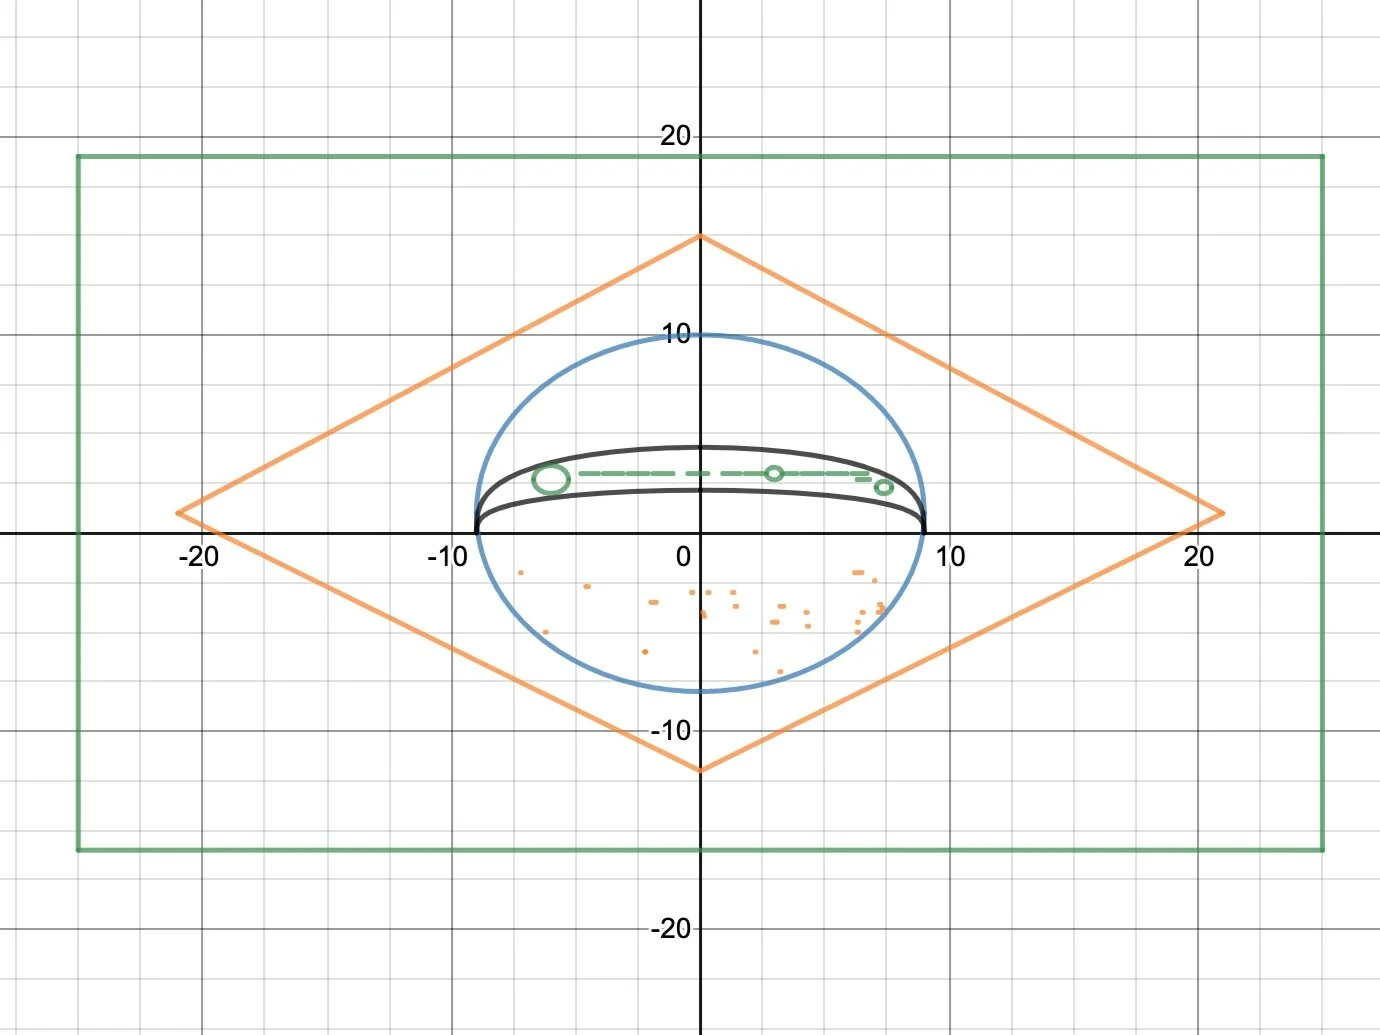
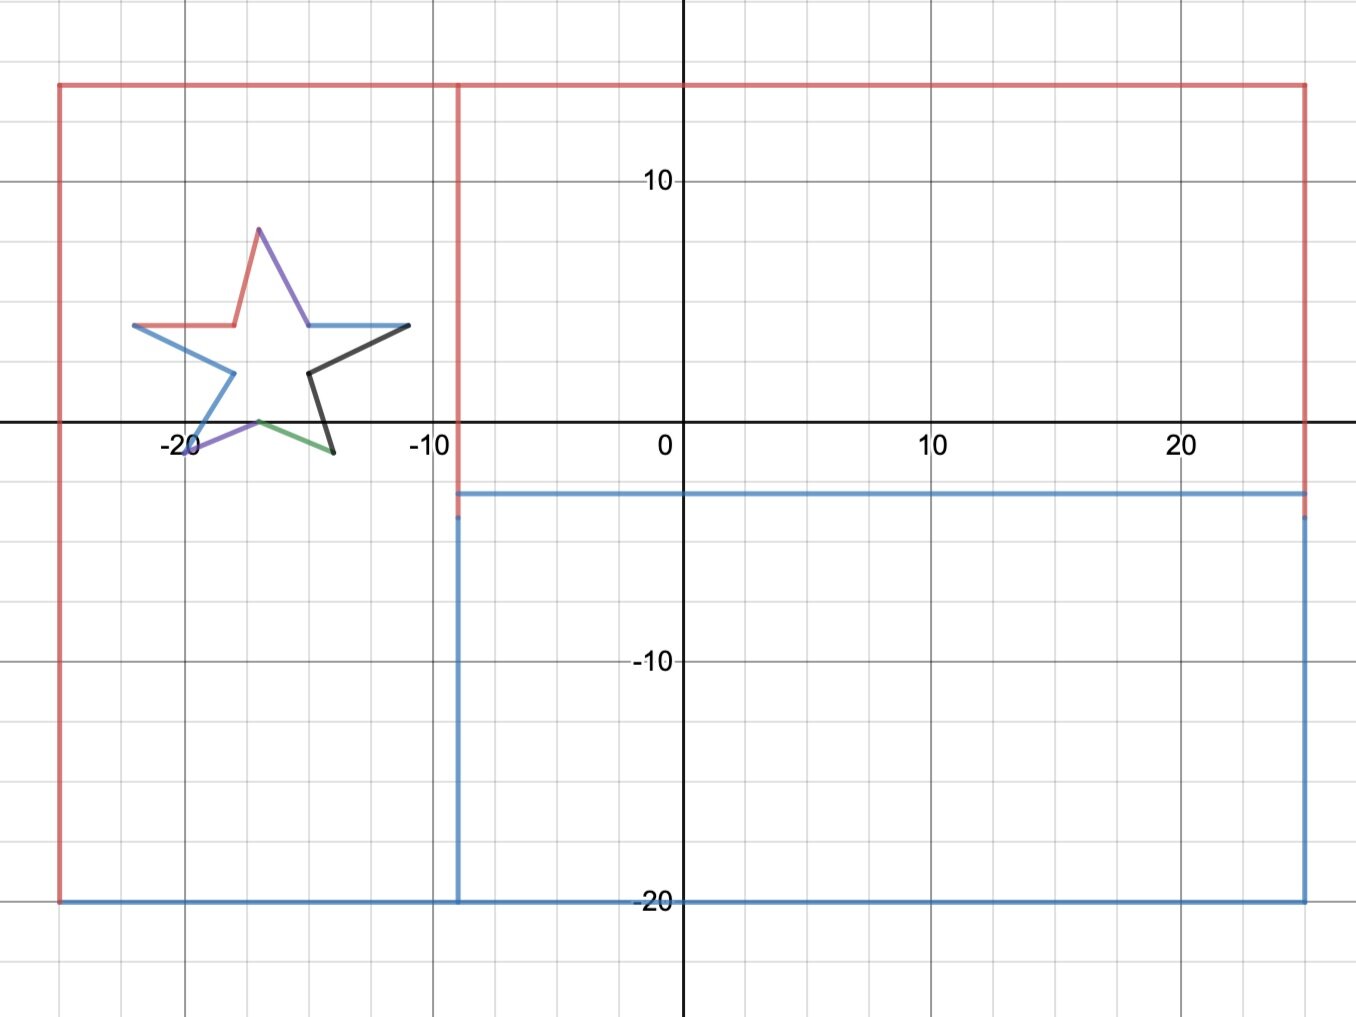
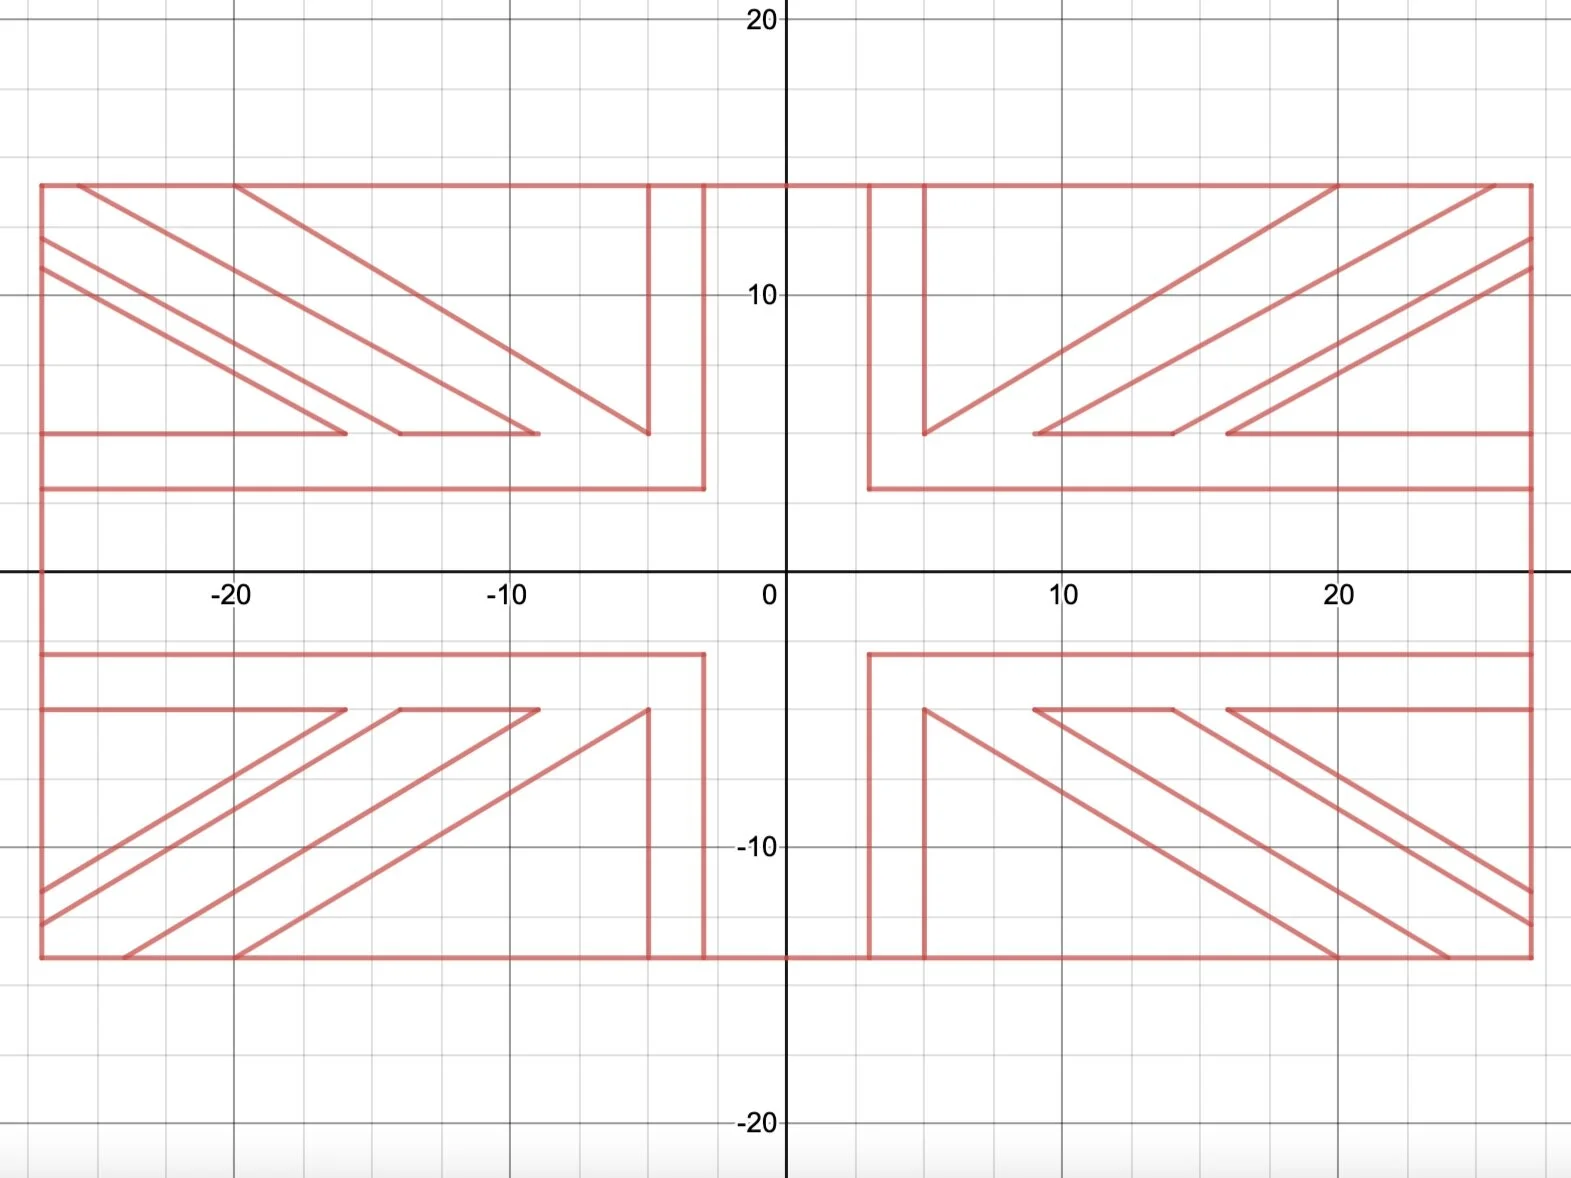
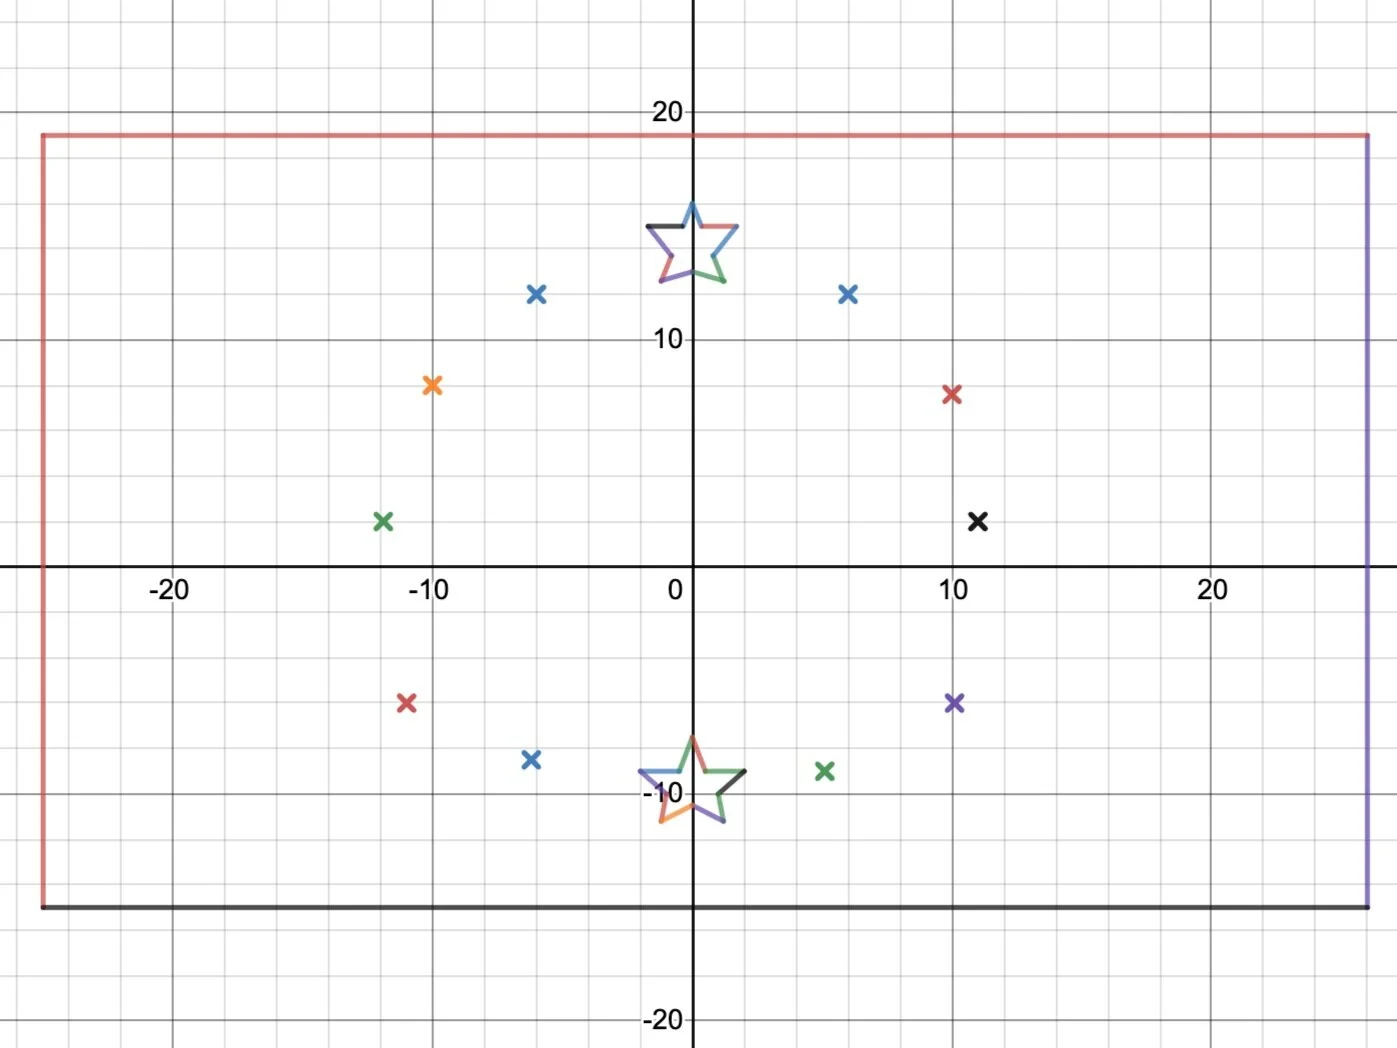
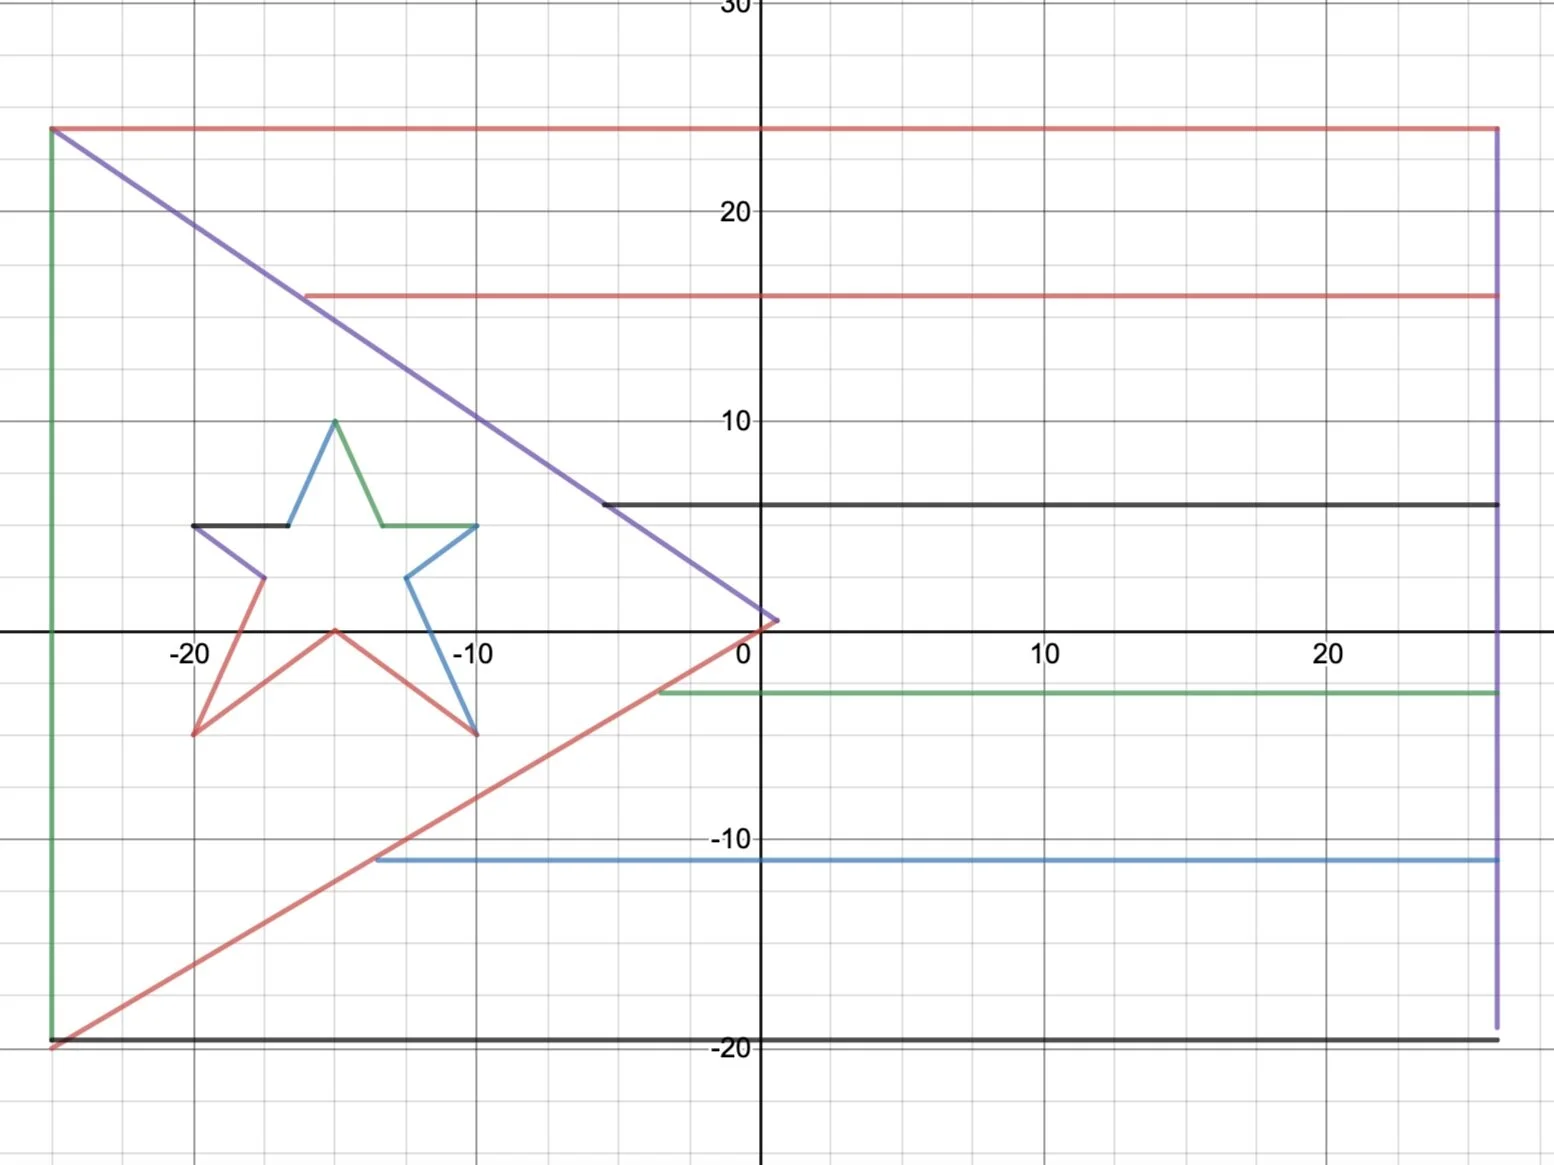
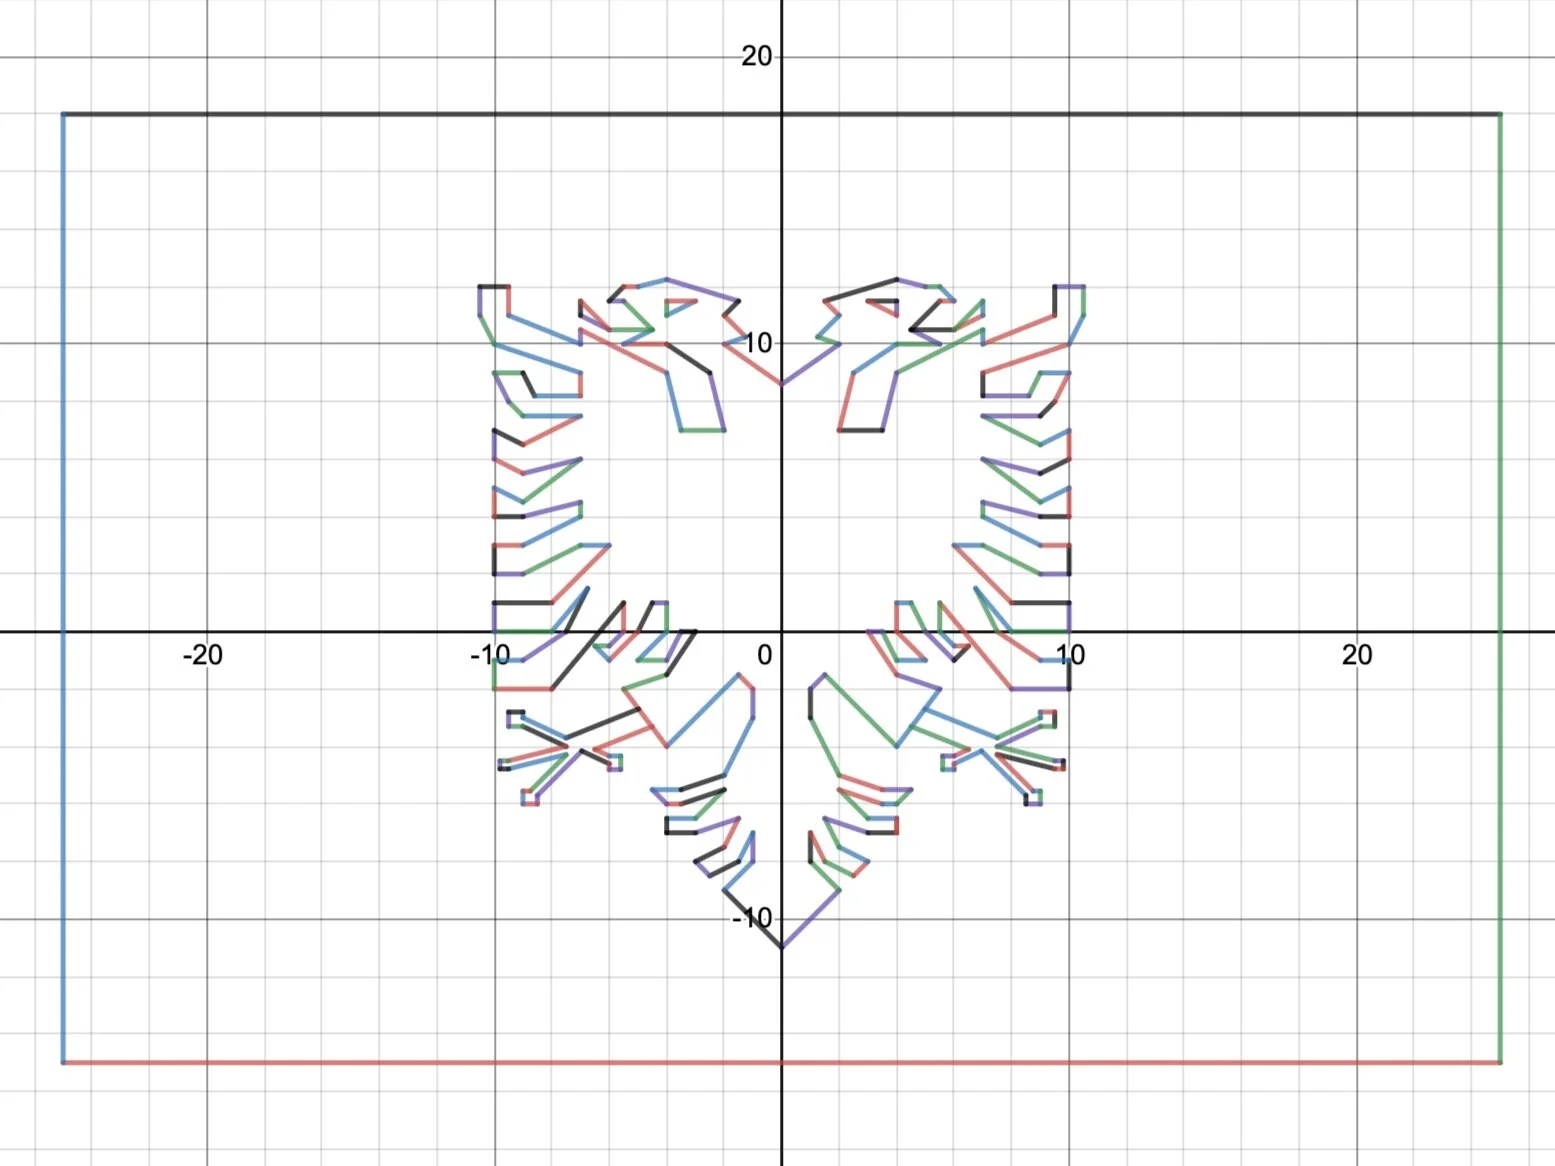
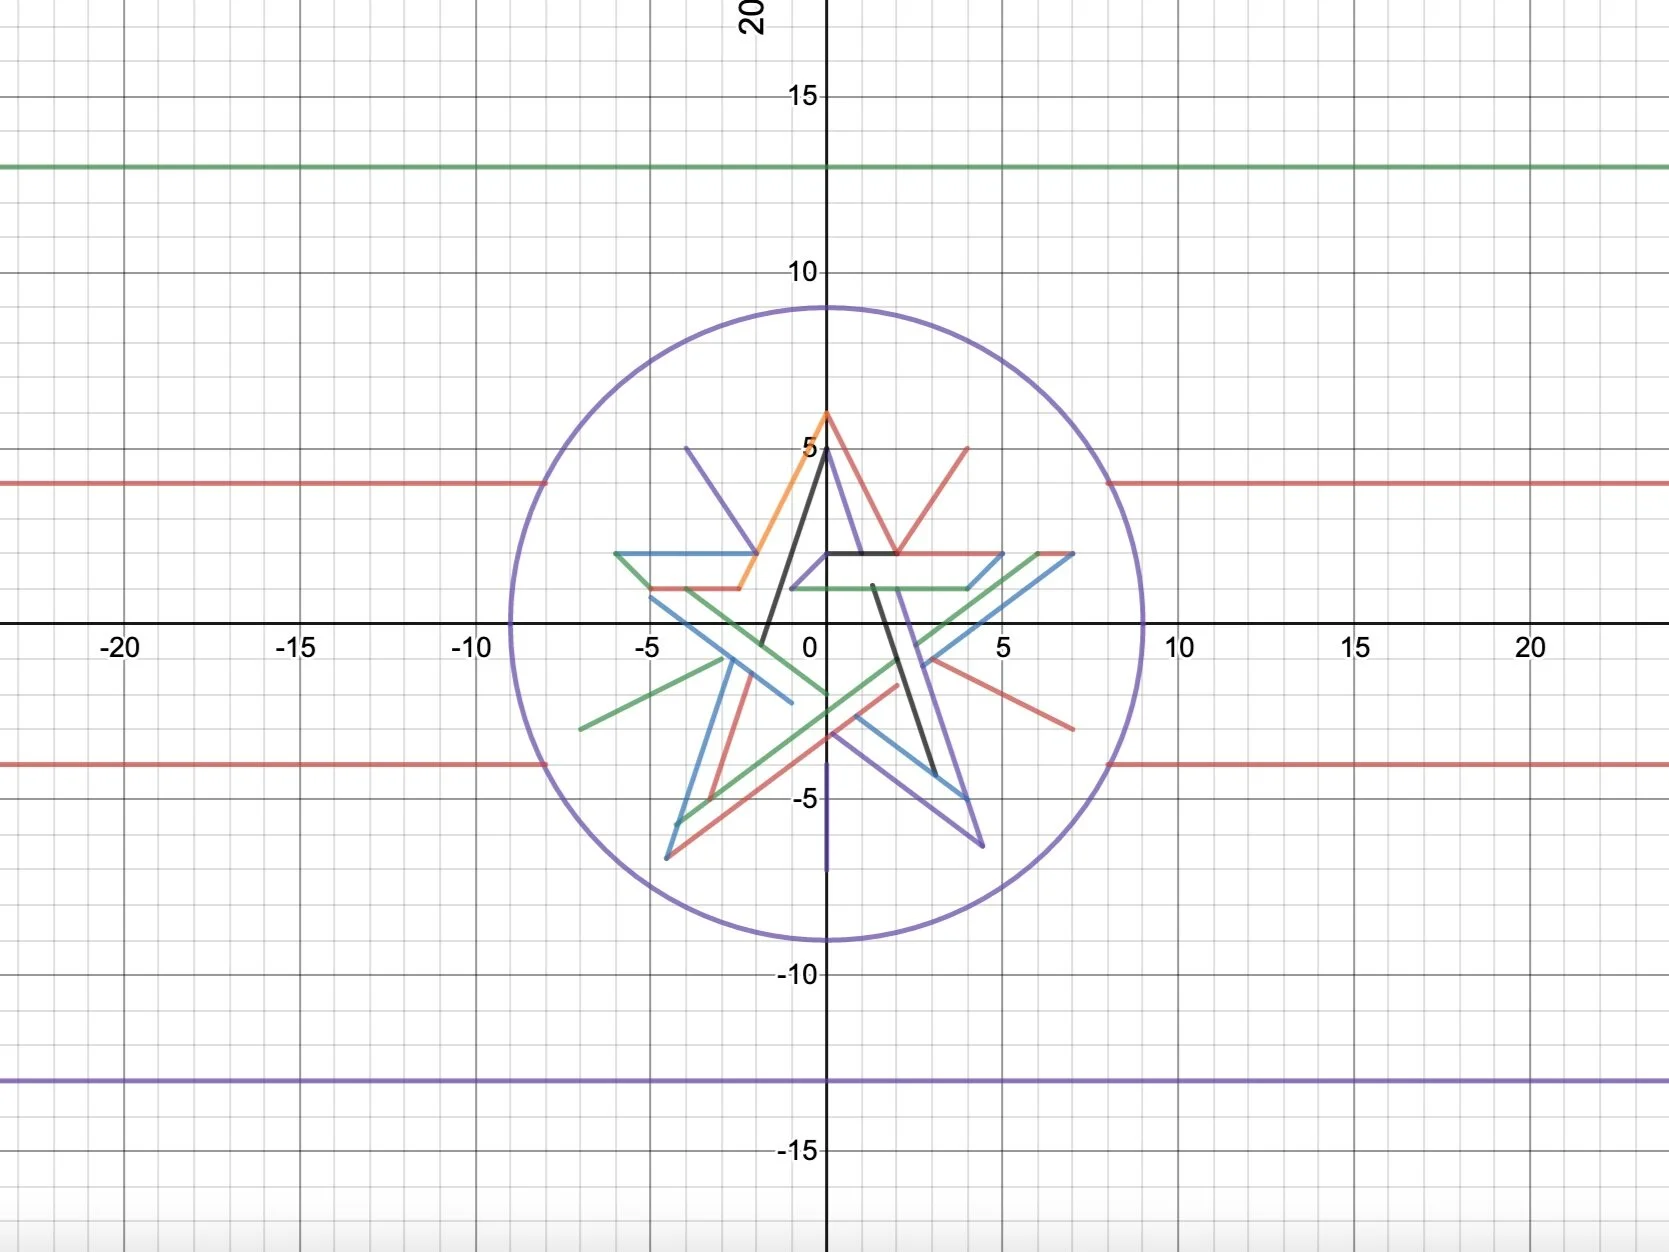
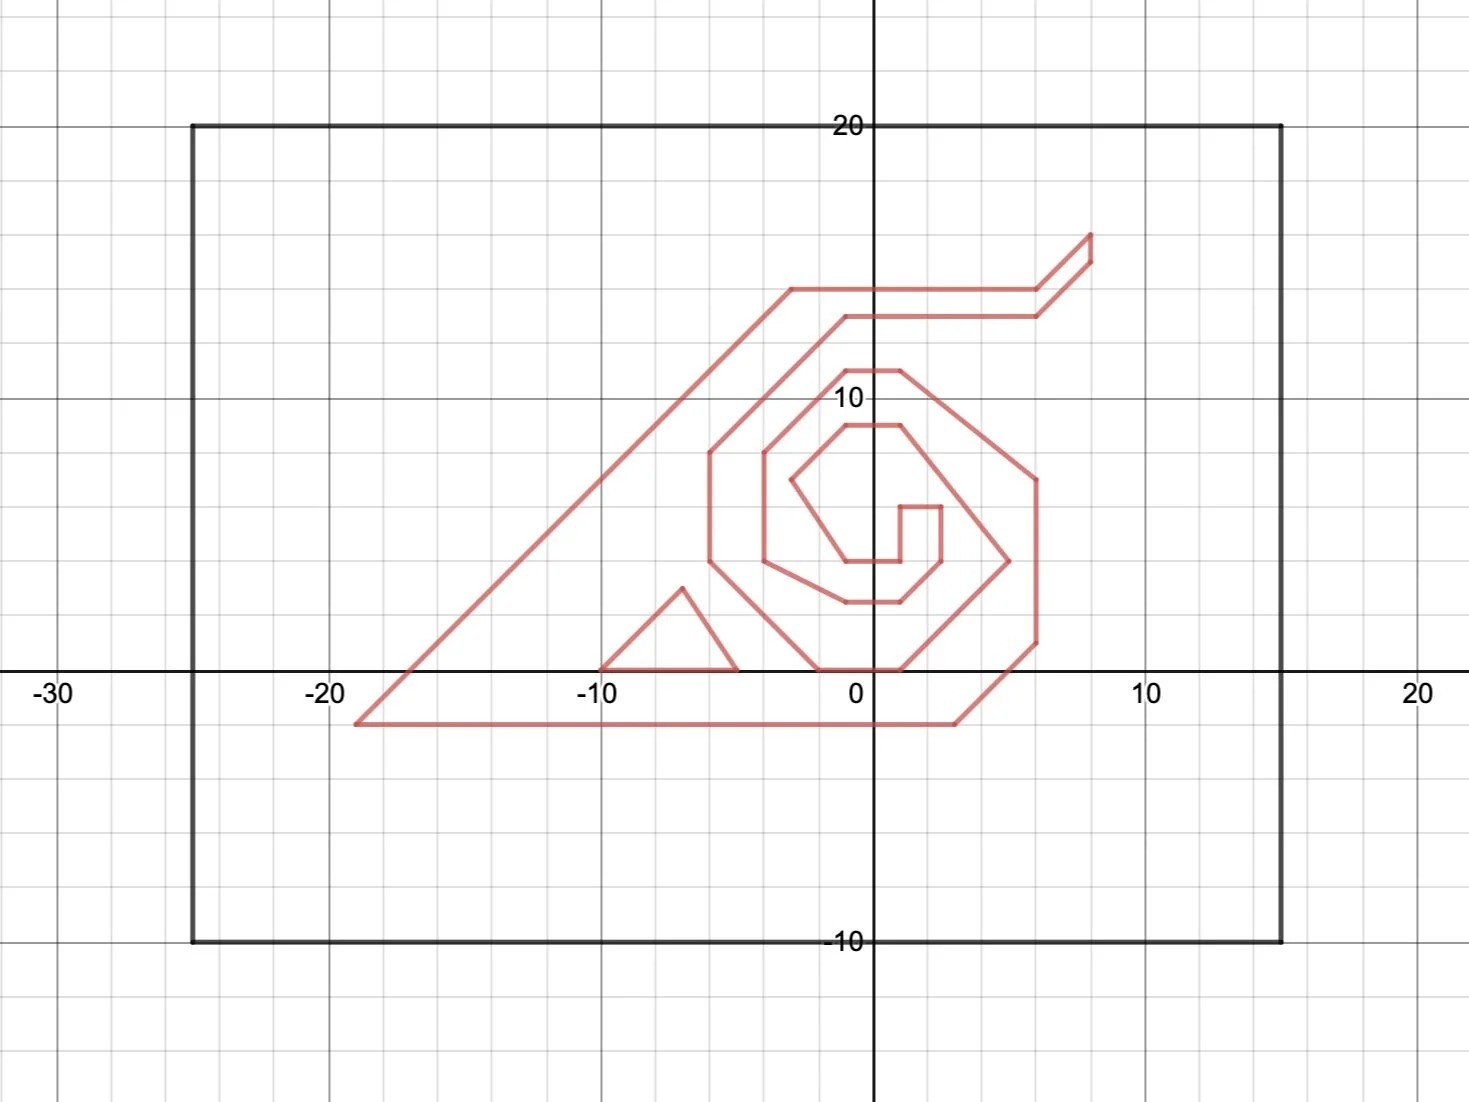
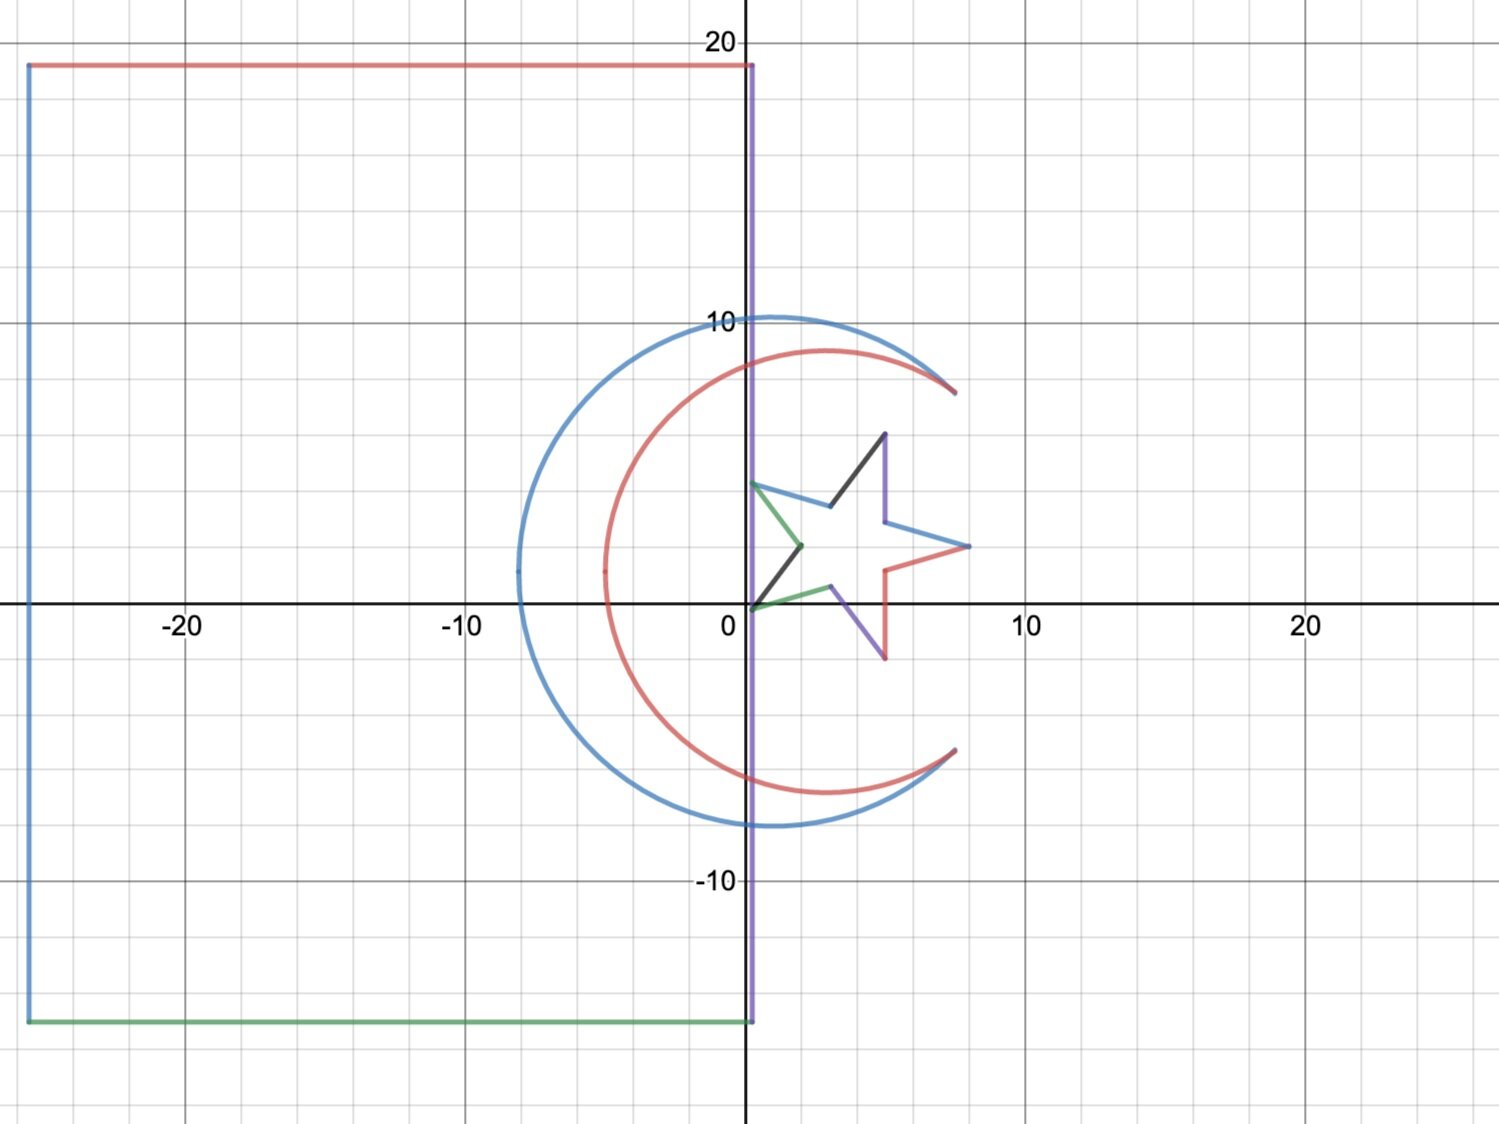
One of the major projects that Div 1 did in MST this trimester was the flag project. After learning about lines, graphing, variables, and negative numbers throughout the first couple of months of school, we were ready to do a project using our knowledge. This precise thing happened. We were all going to pick a flag, any flag, and find the slope, y-intercept, and boundaries of each line segment in the flag that we had chosen. When we had found this information, we would make an equation for the line and put it into Desmos, a graphing calculator. Then, after all the equations for all the lines had been found, we would have a beautiful, and perhaps best of all, mathematically precise recreation of our flag.
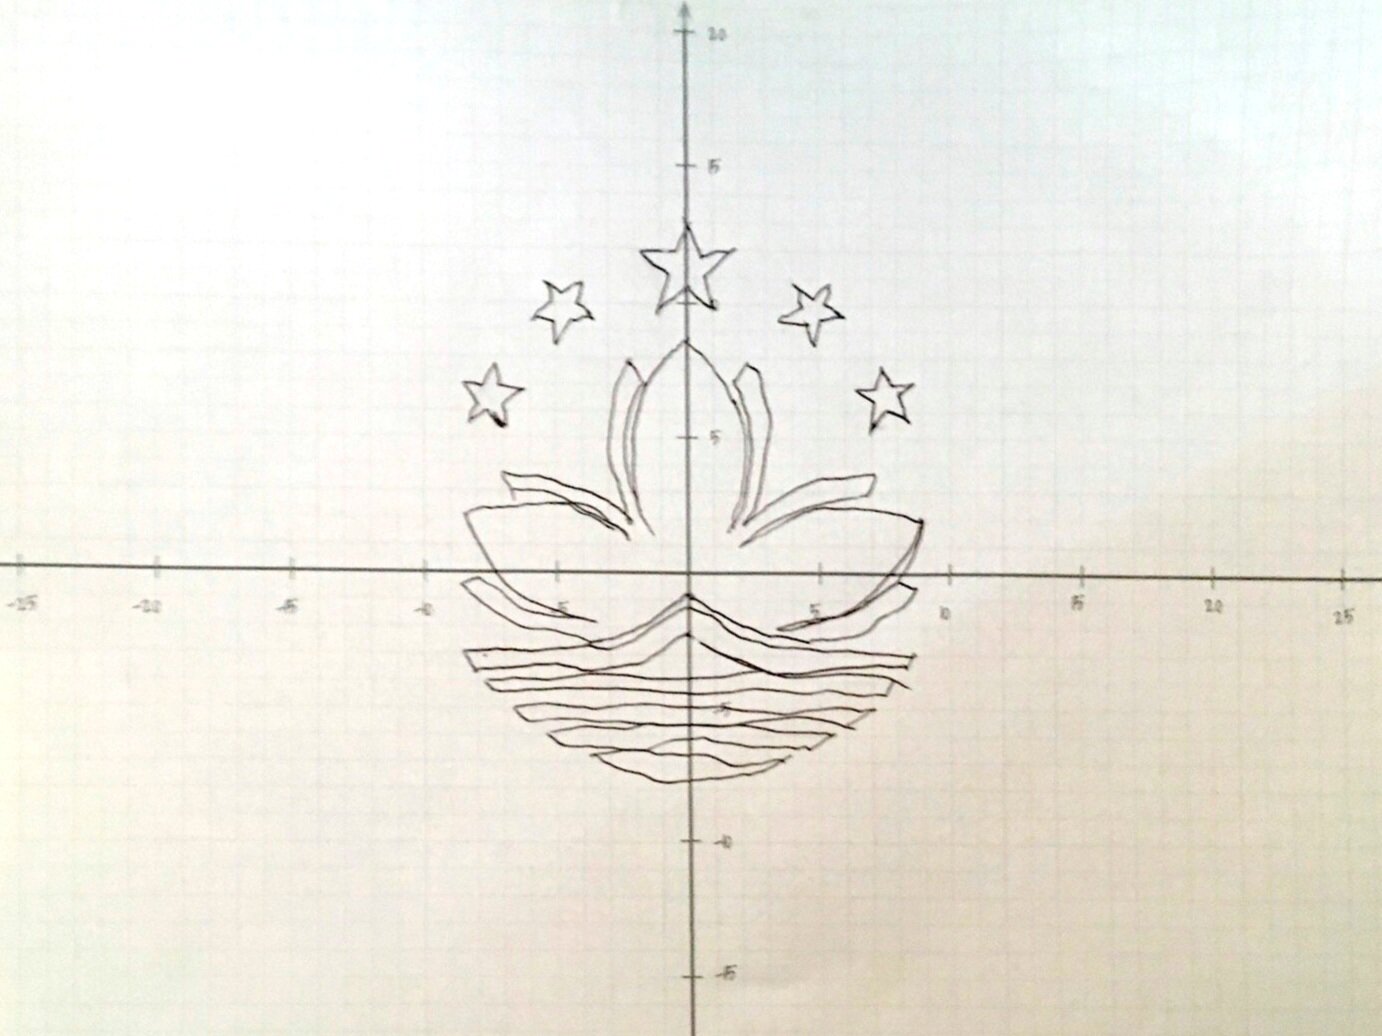
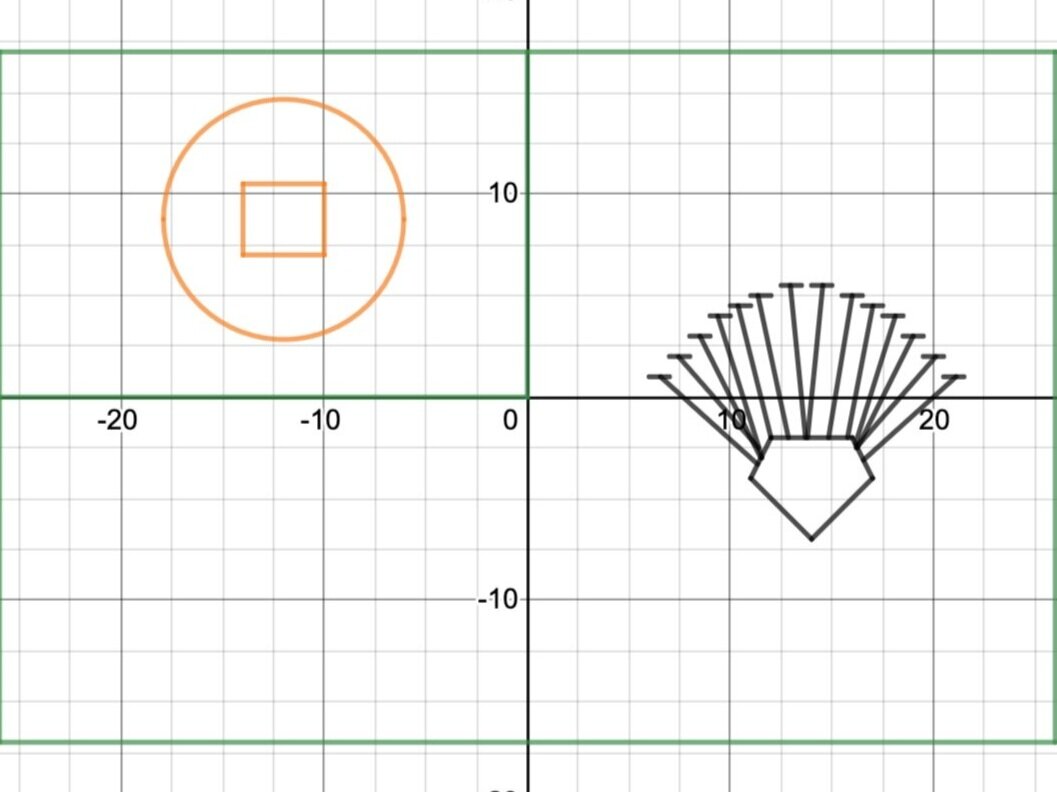
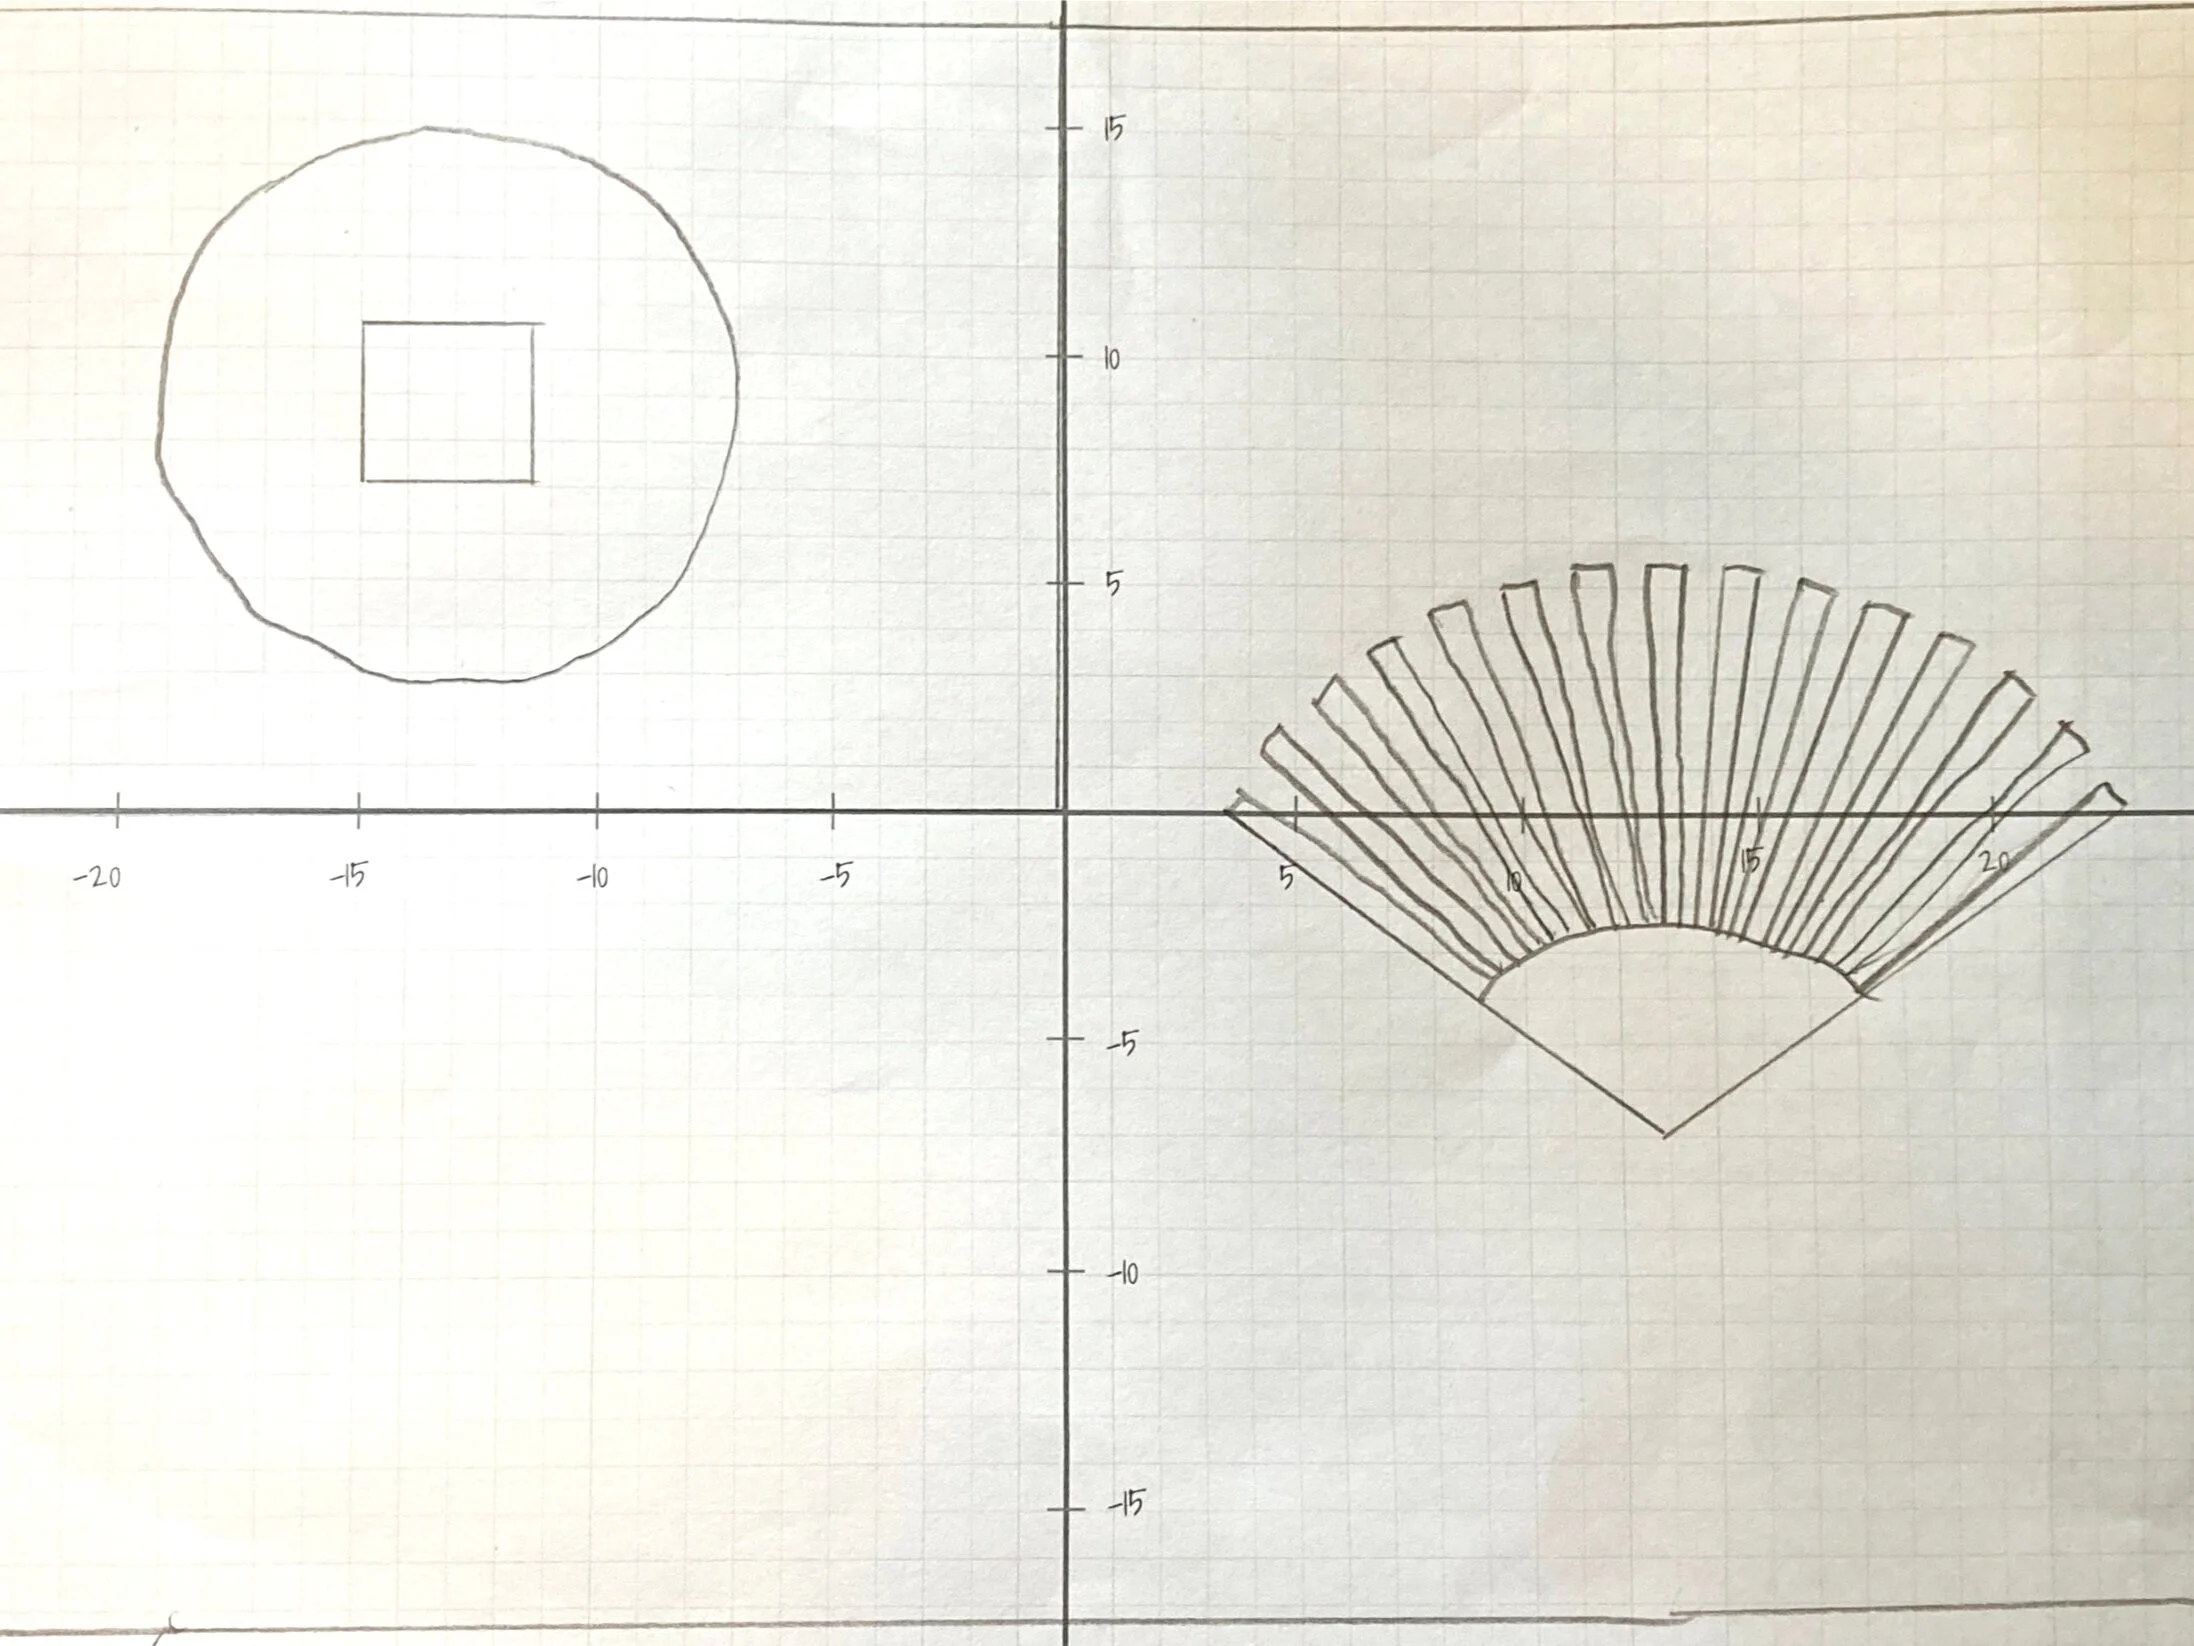
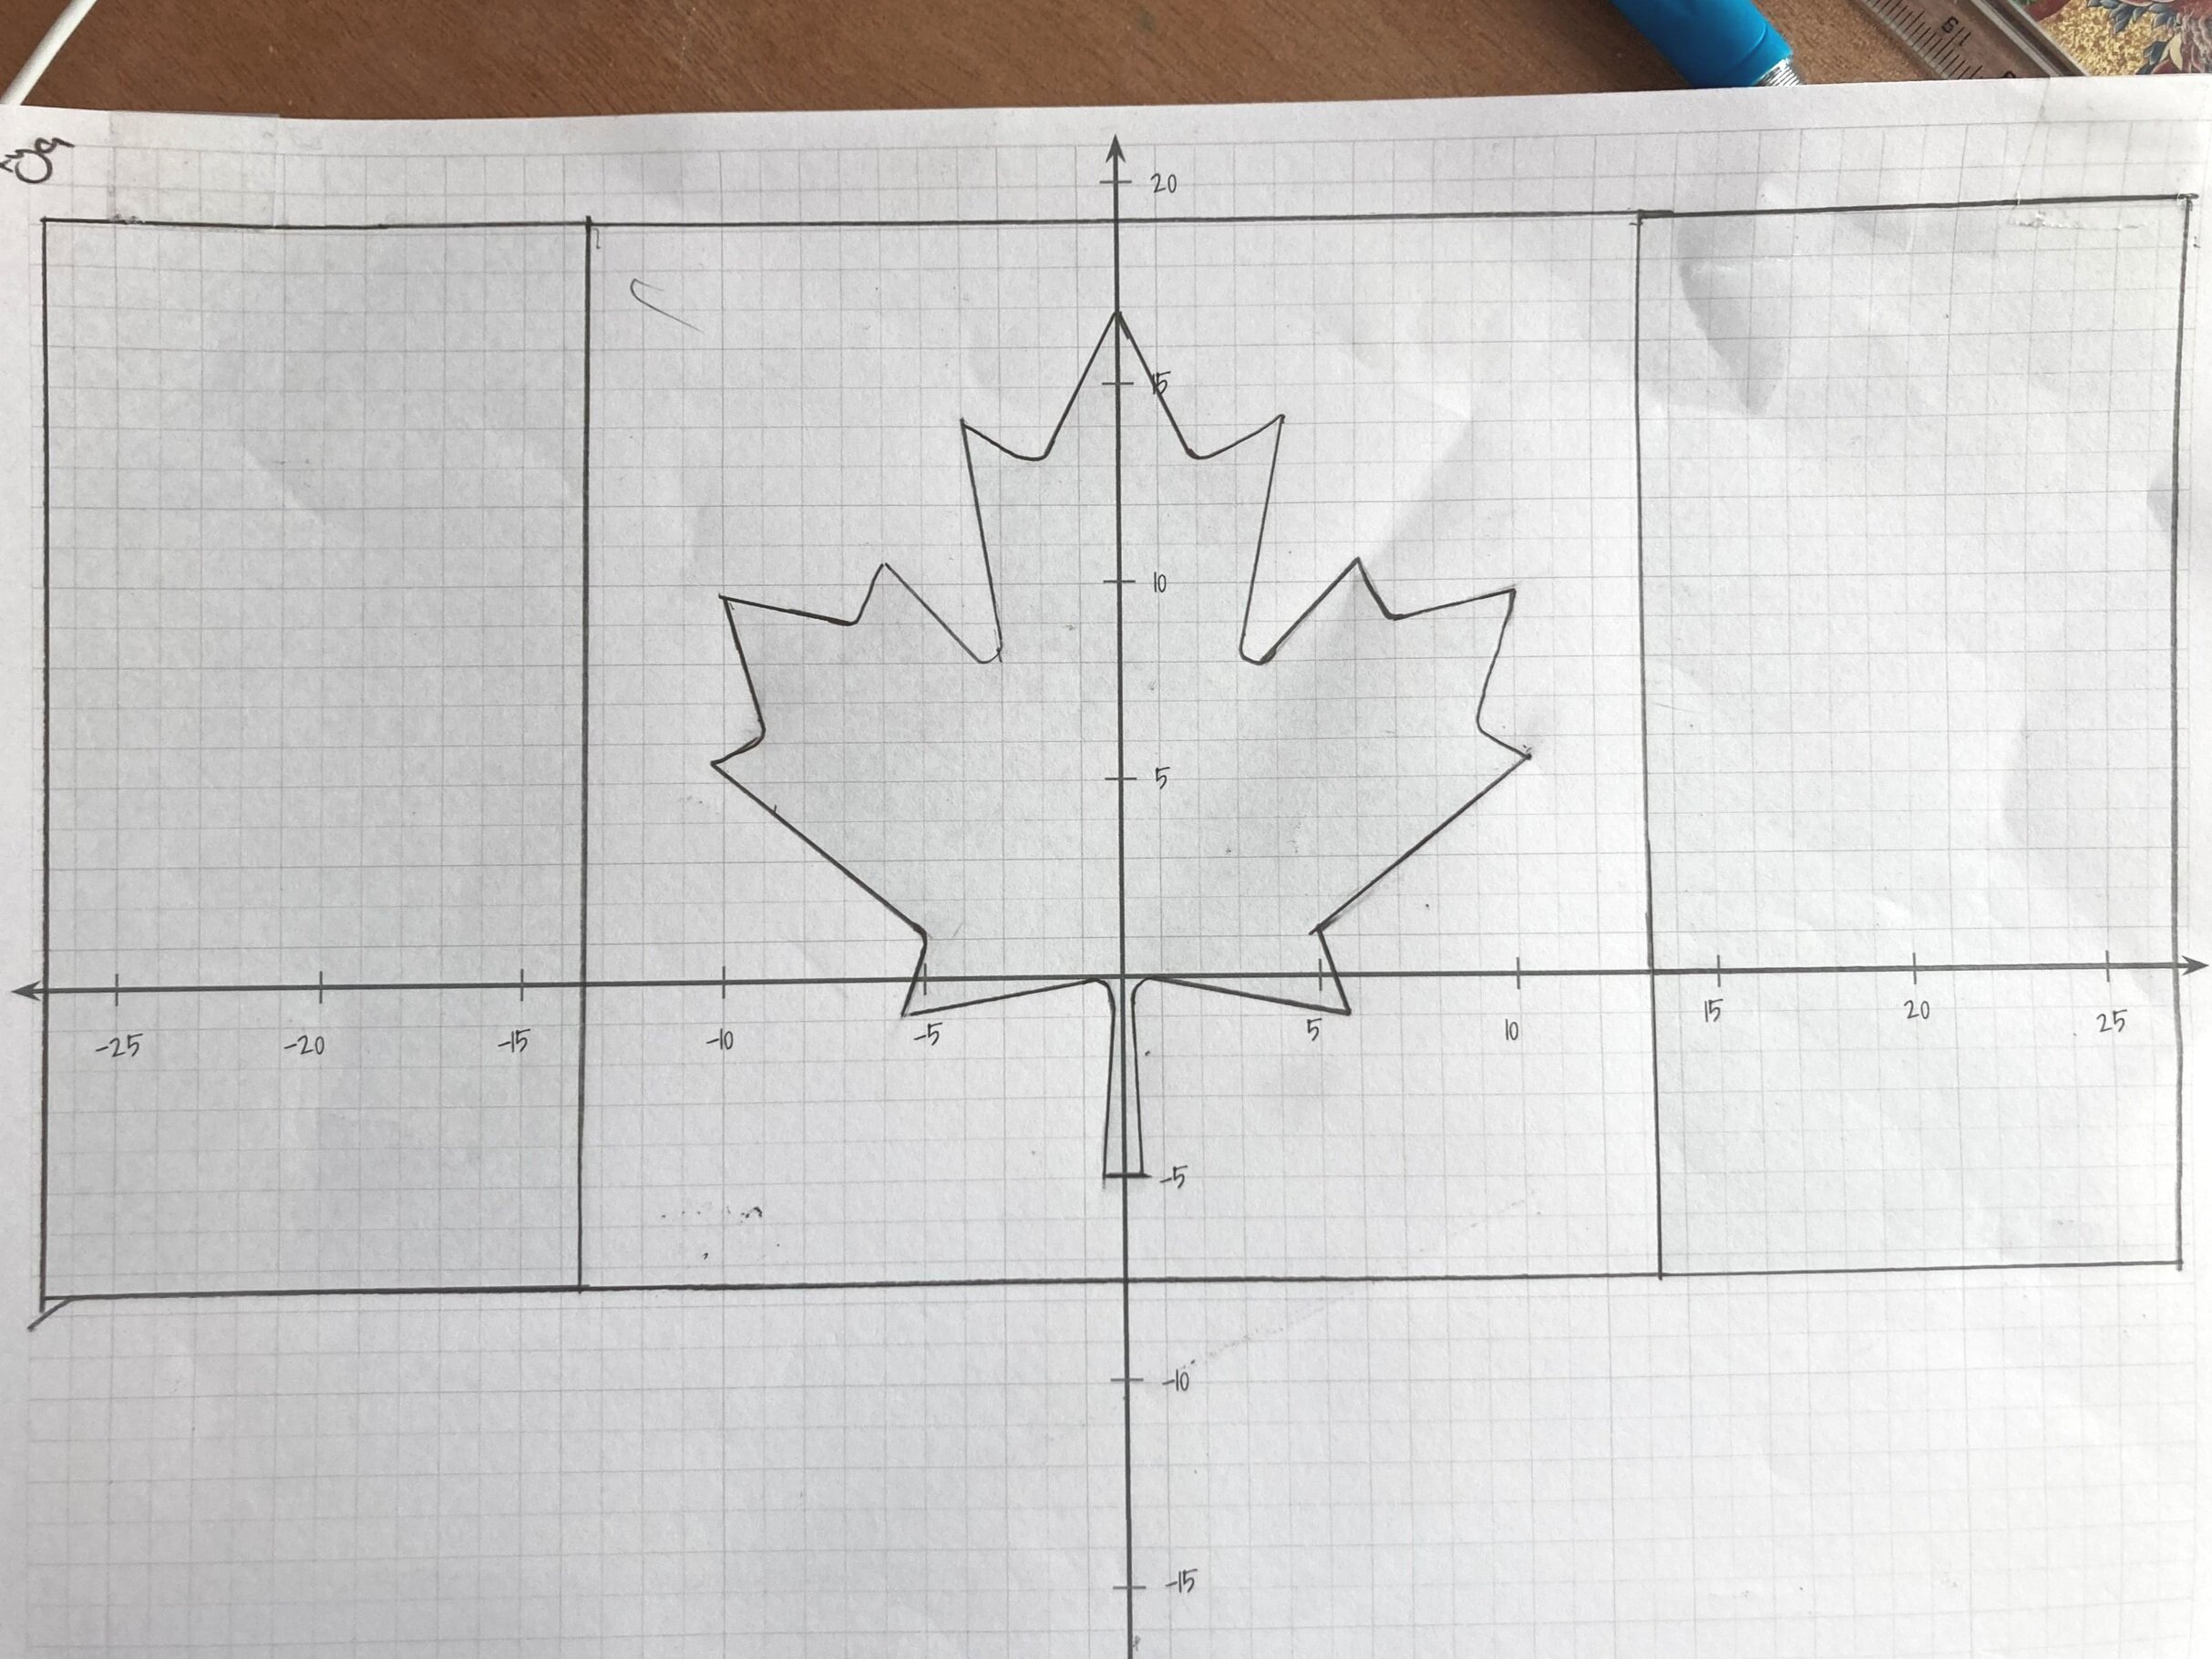
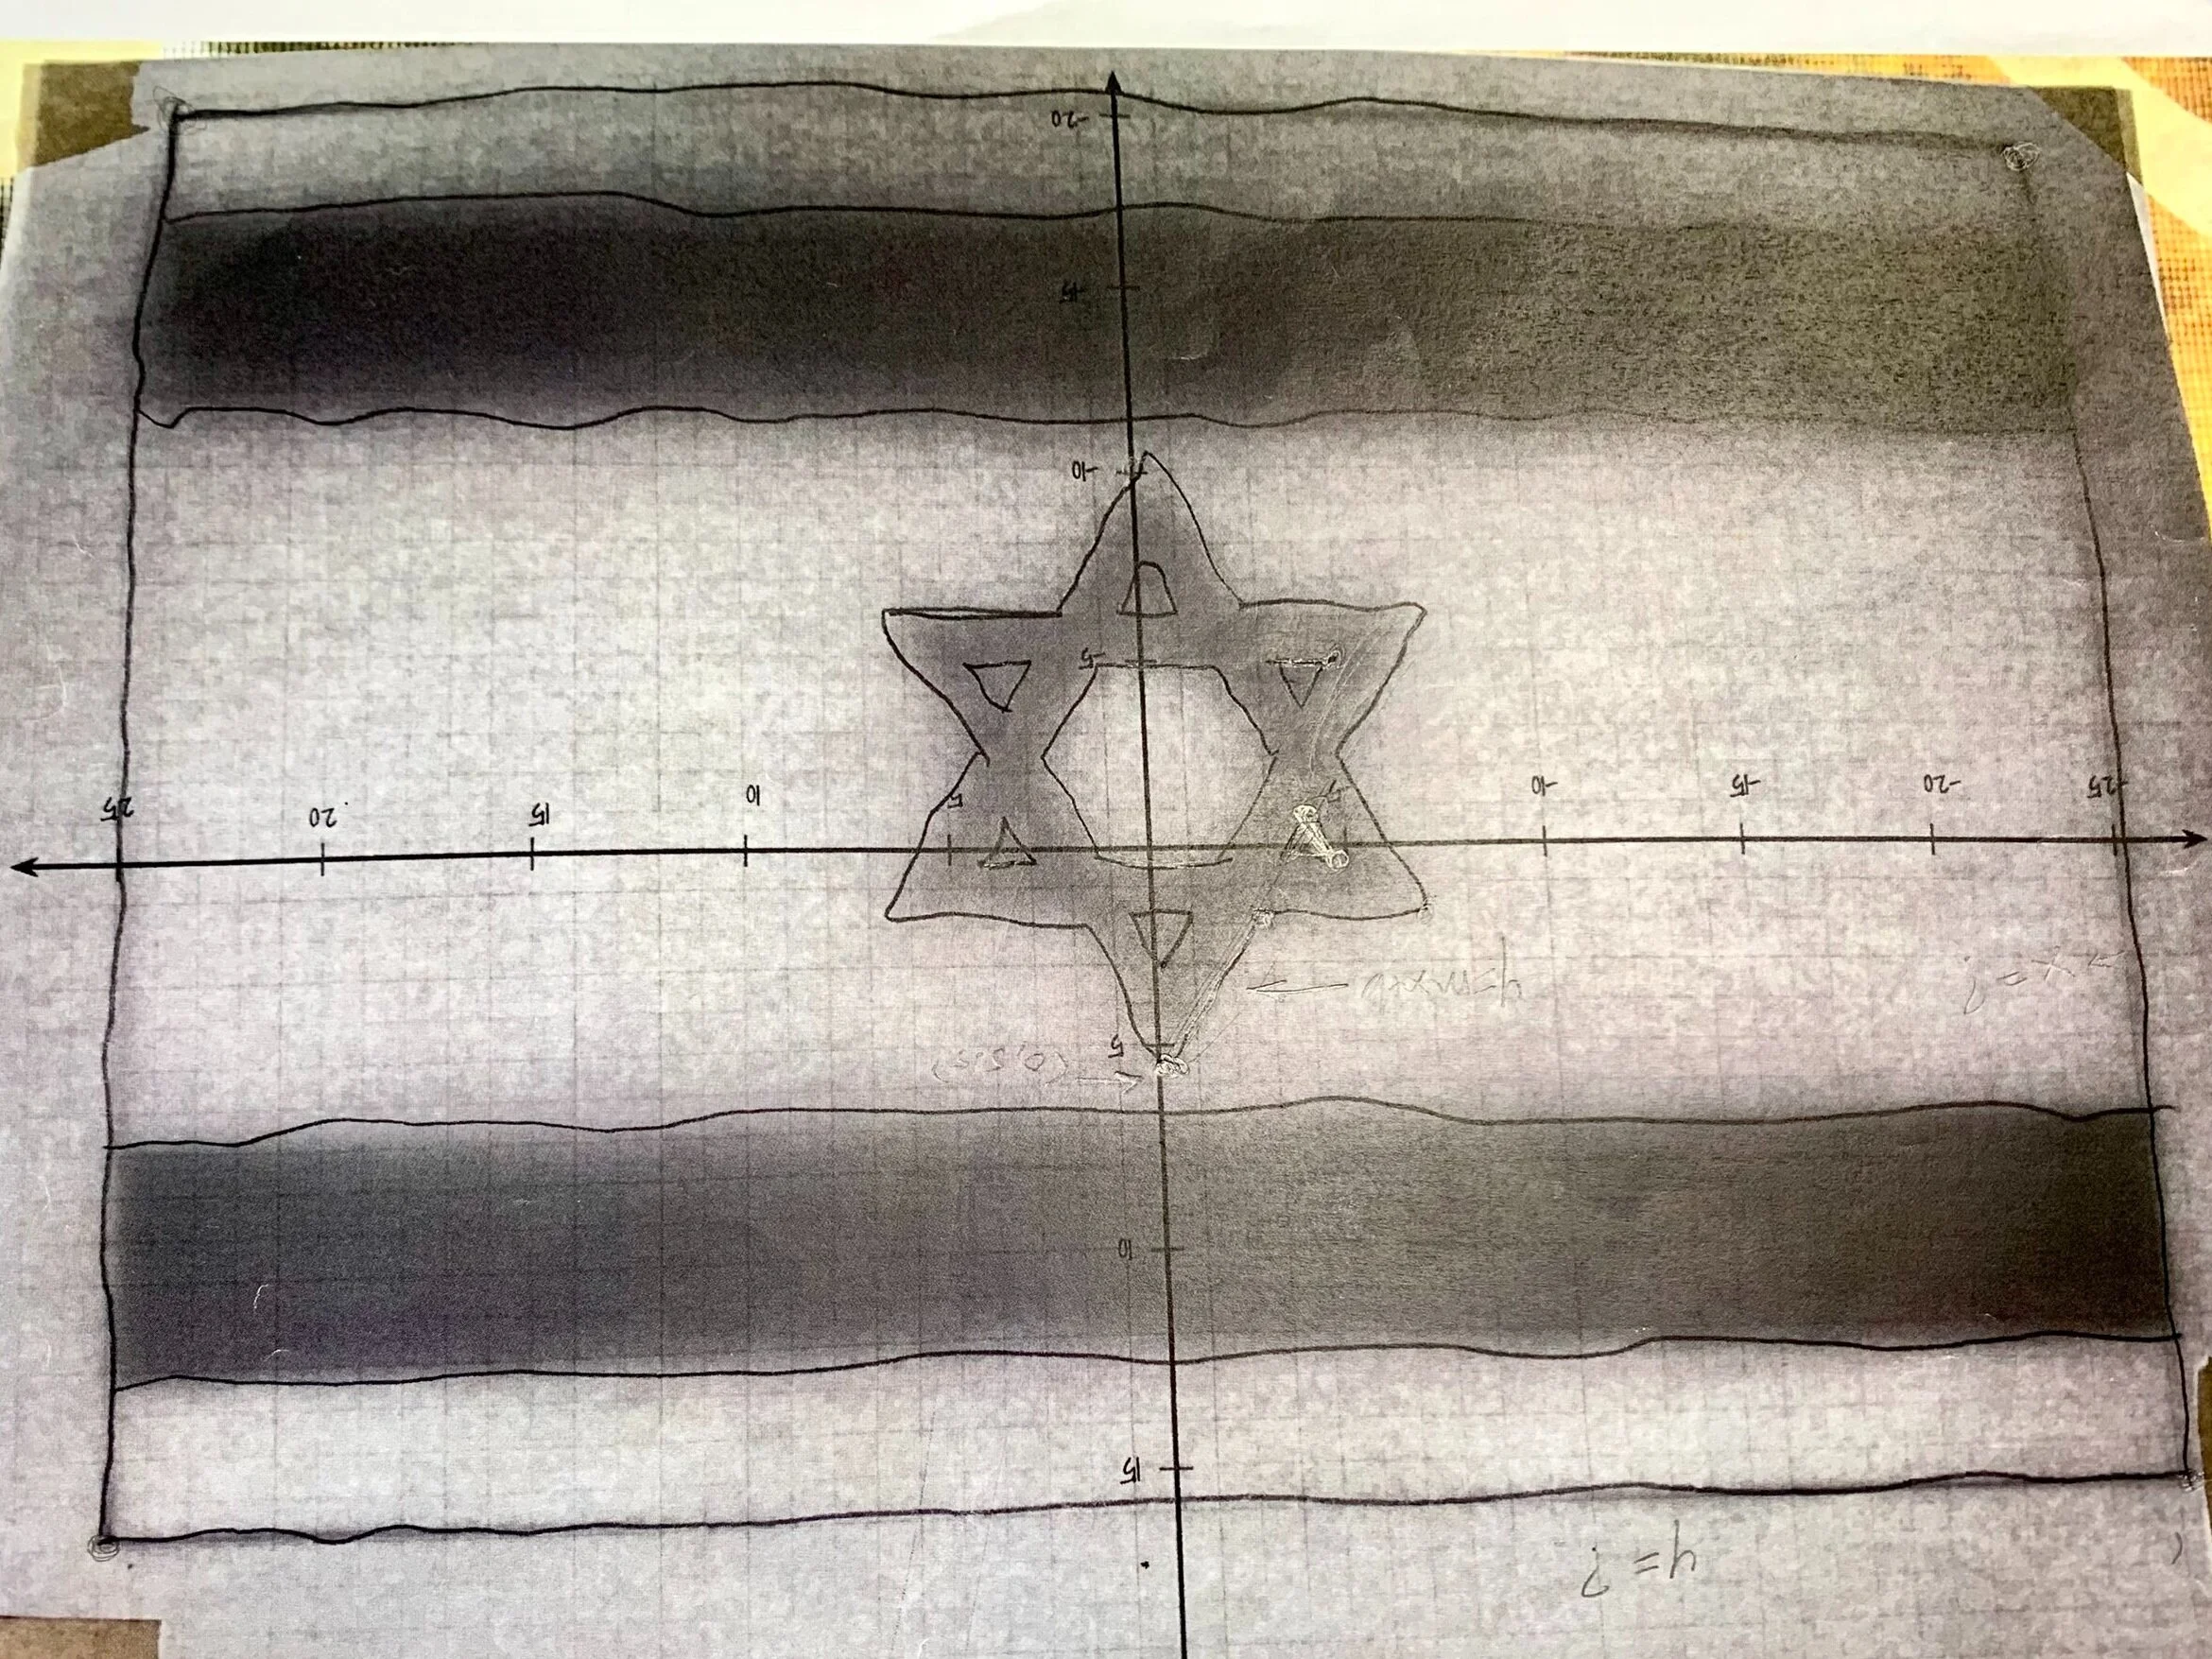
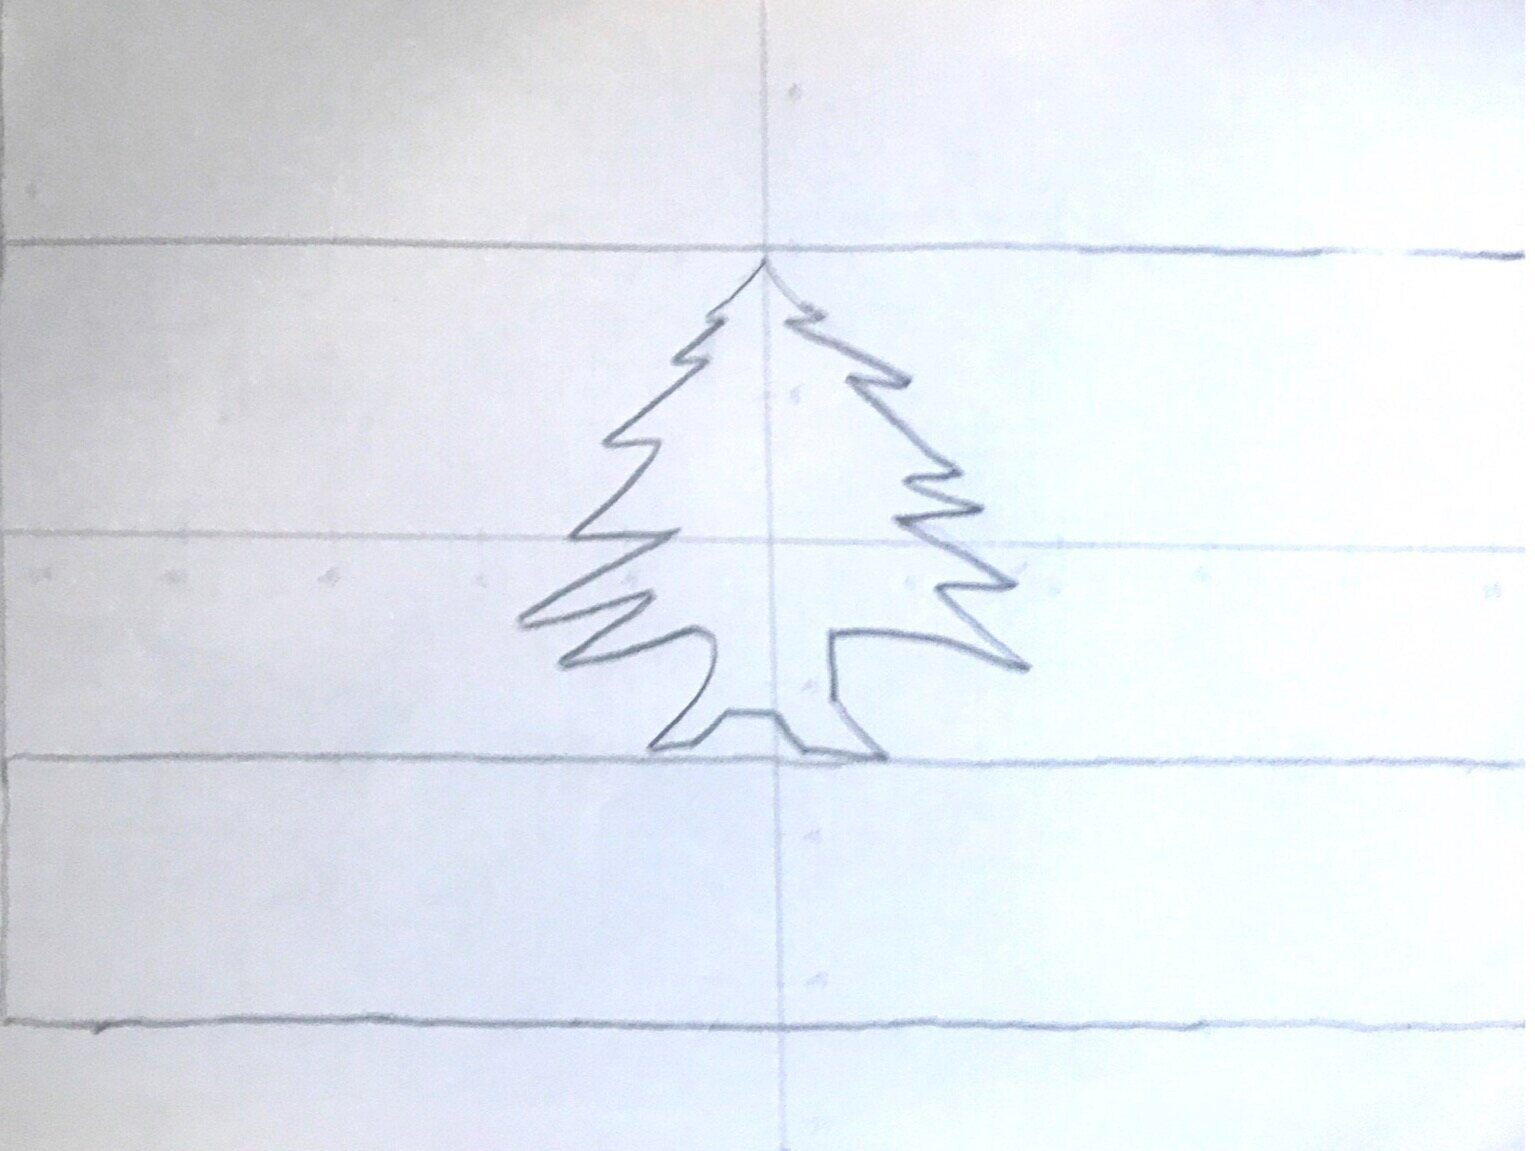
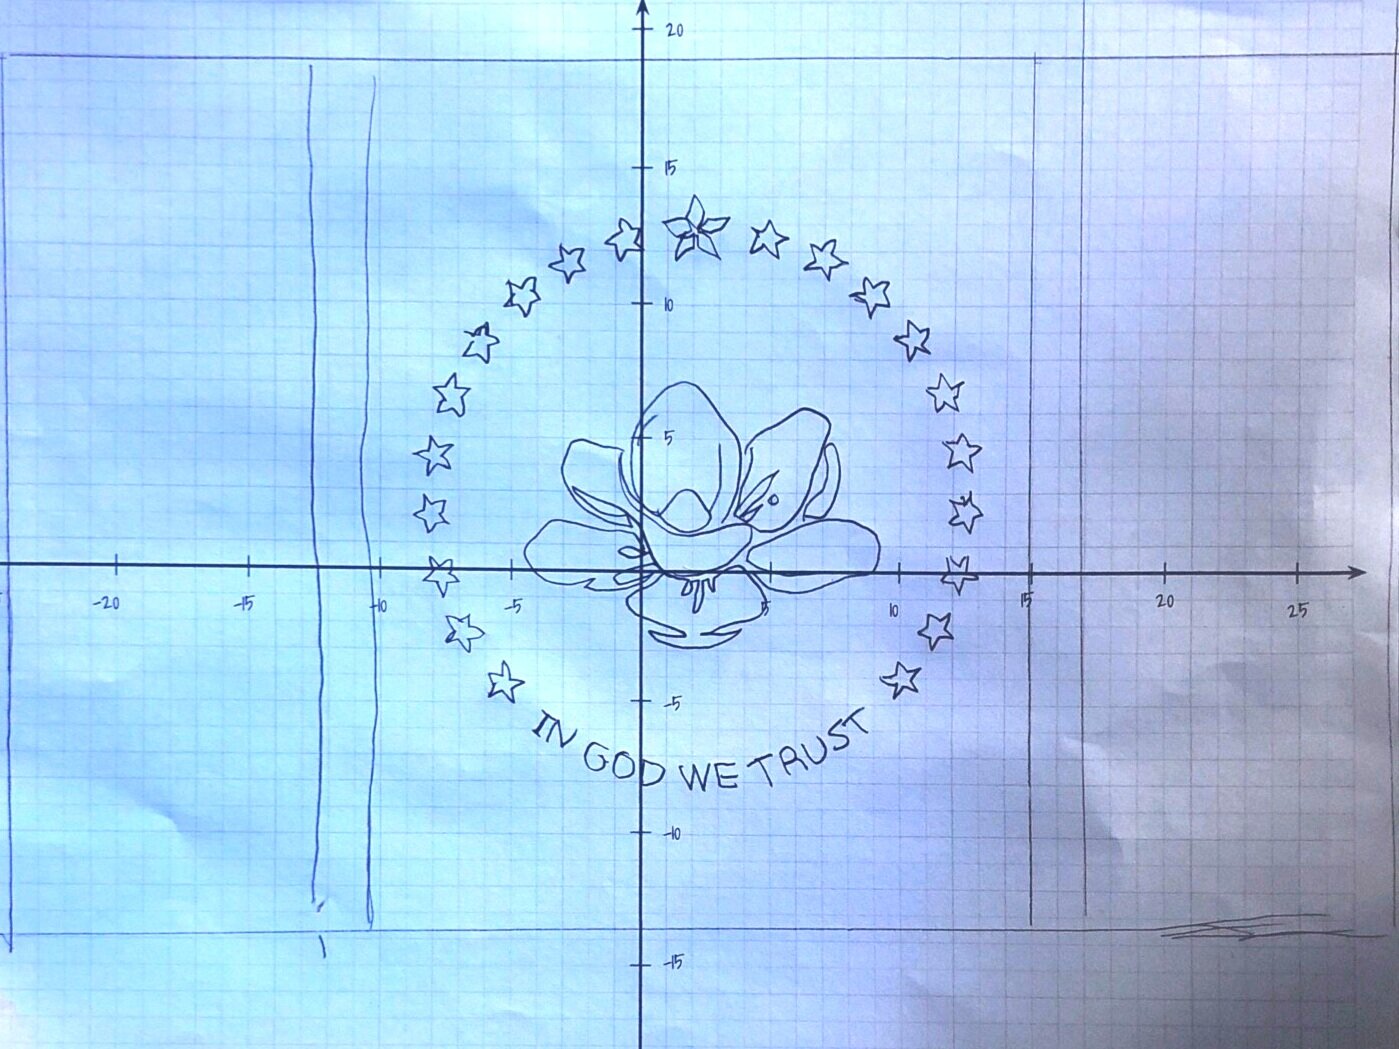
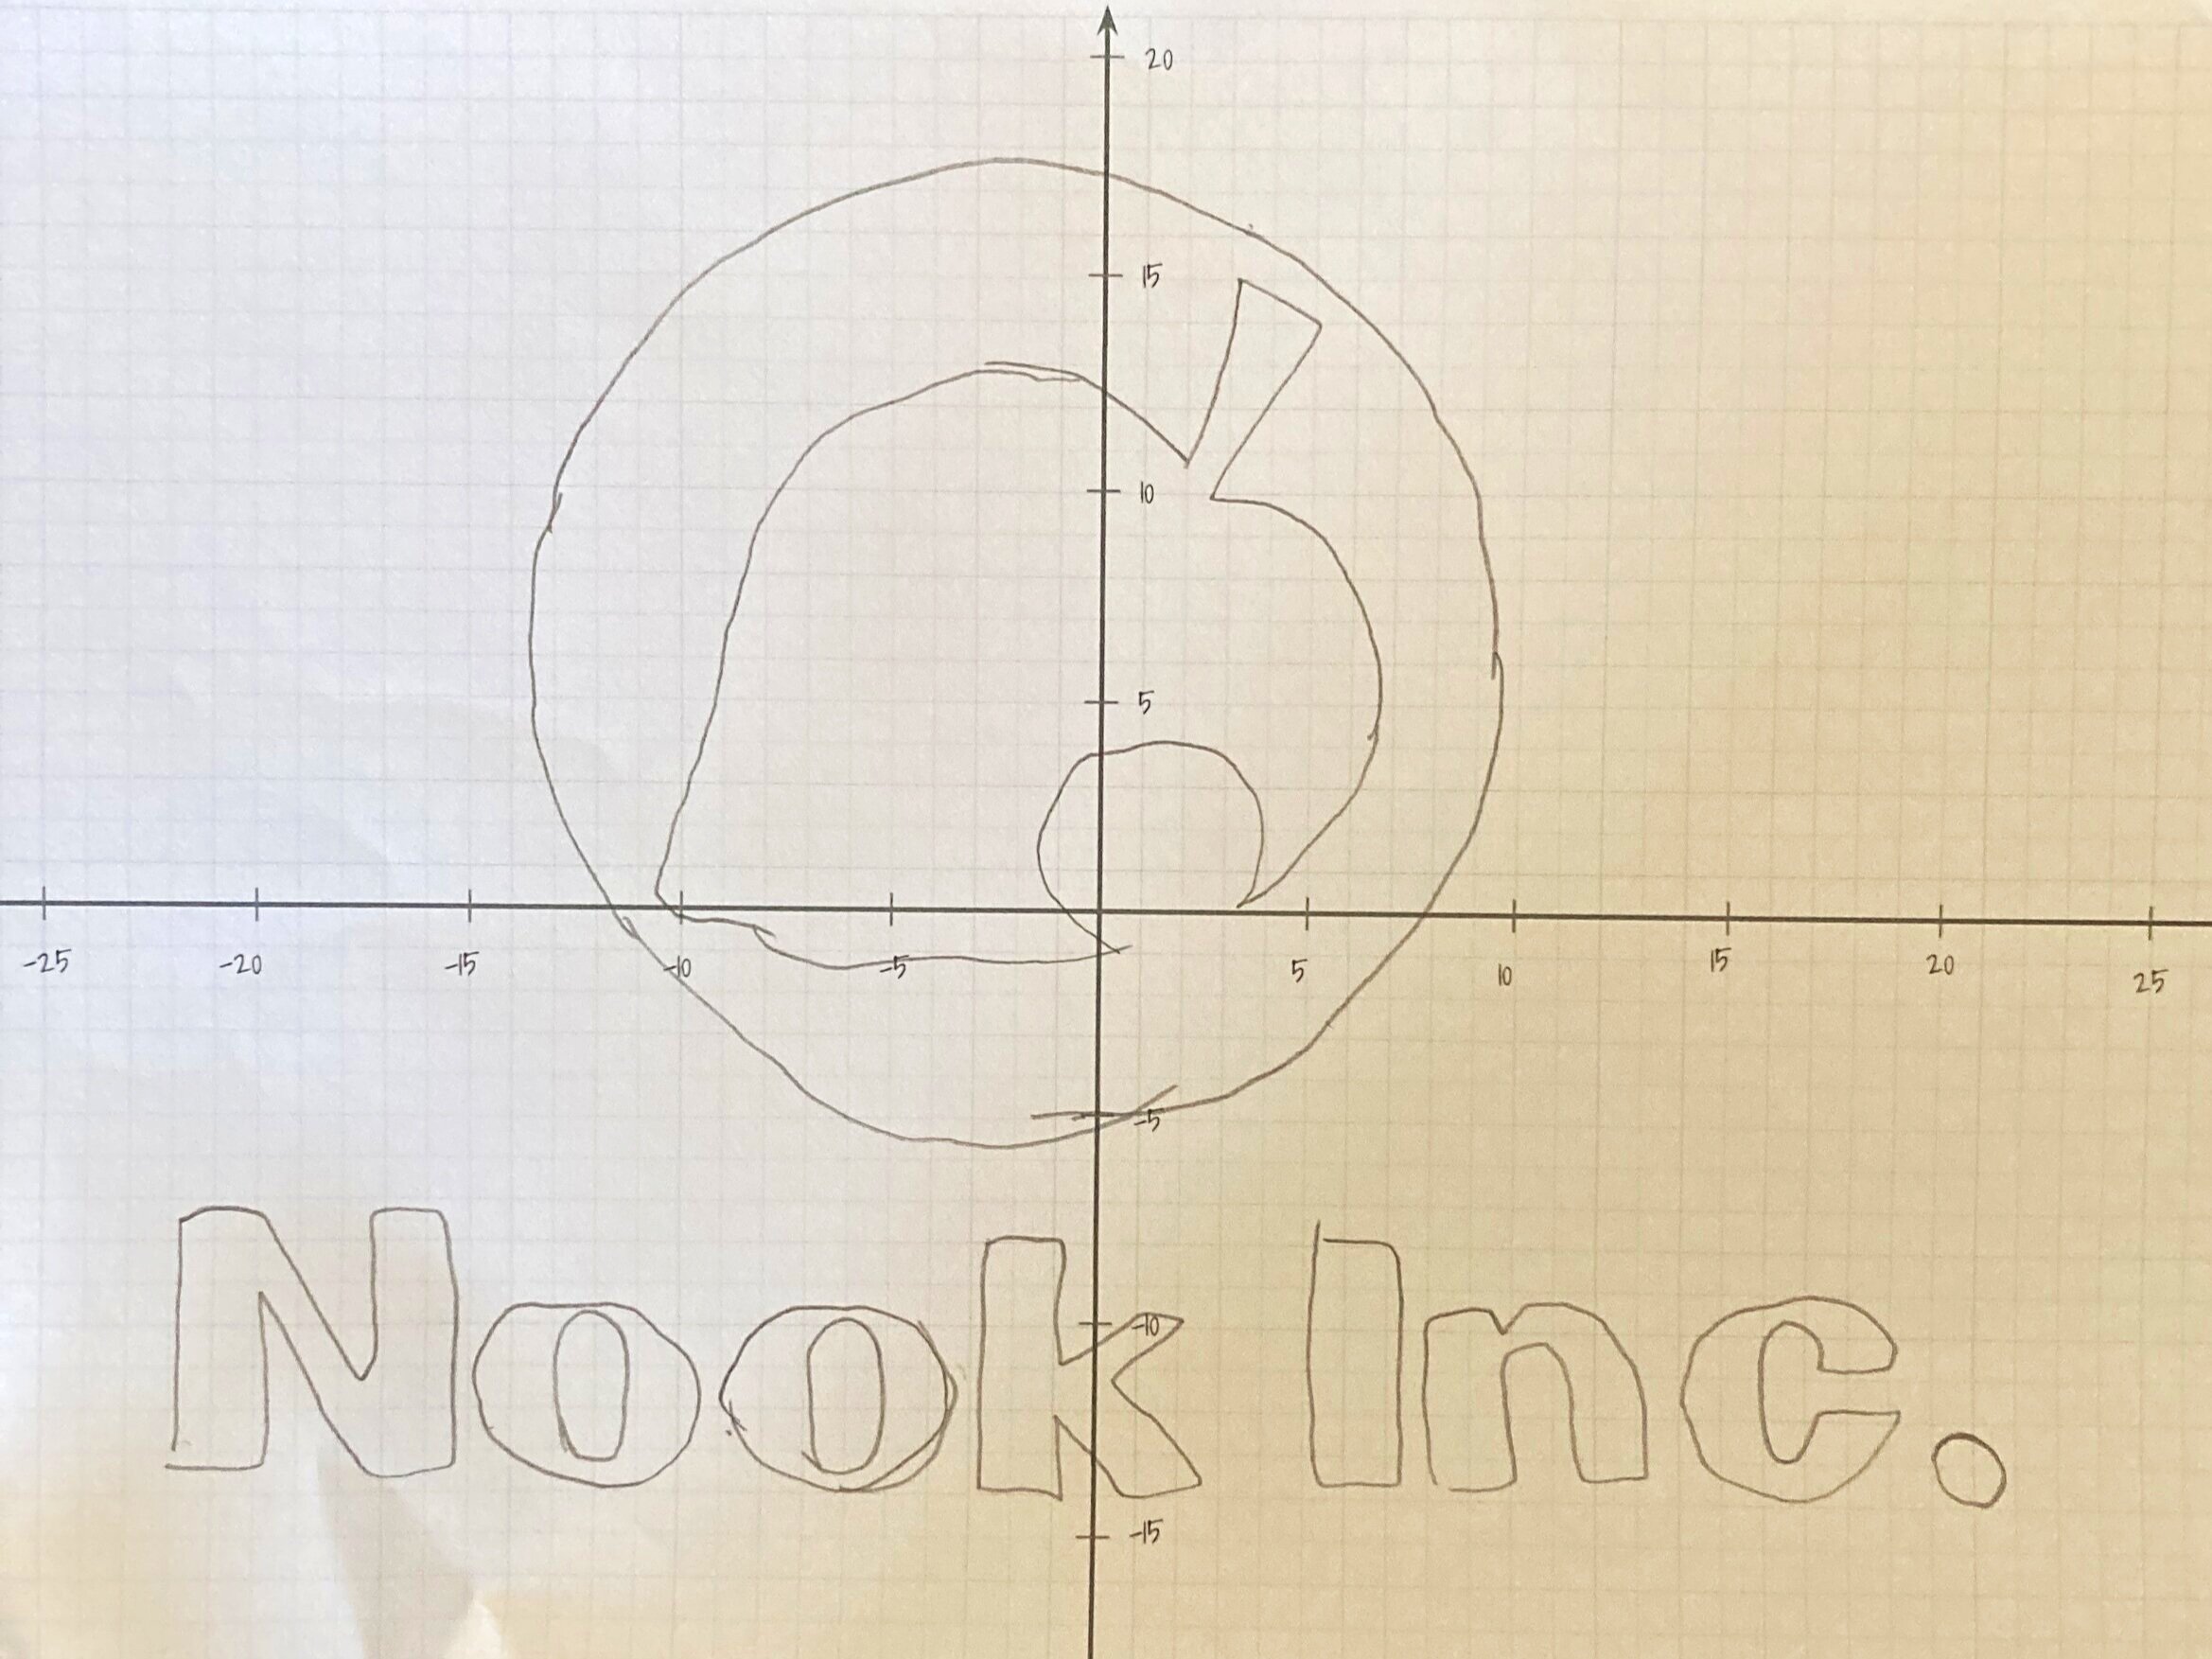
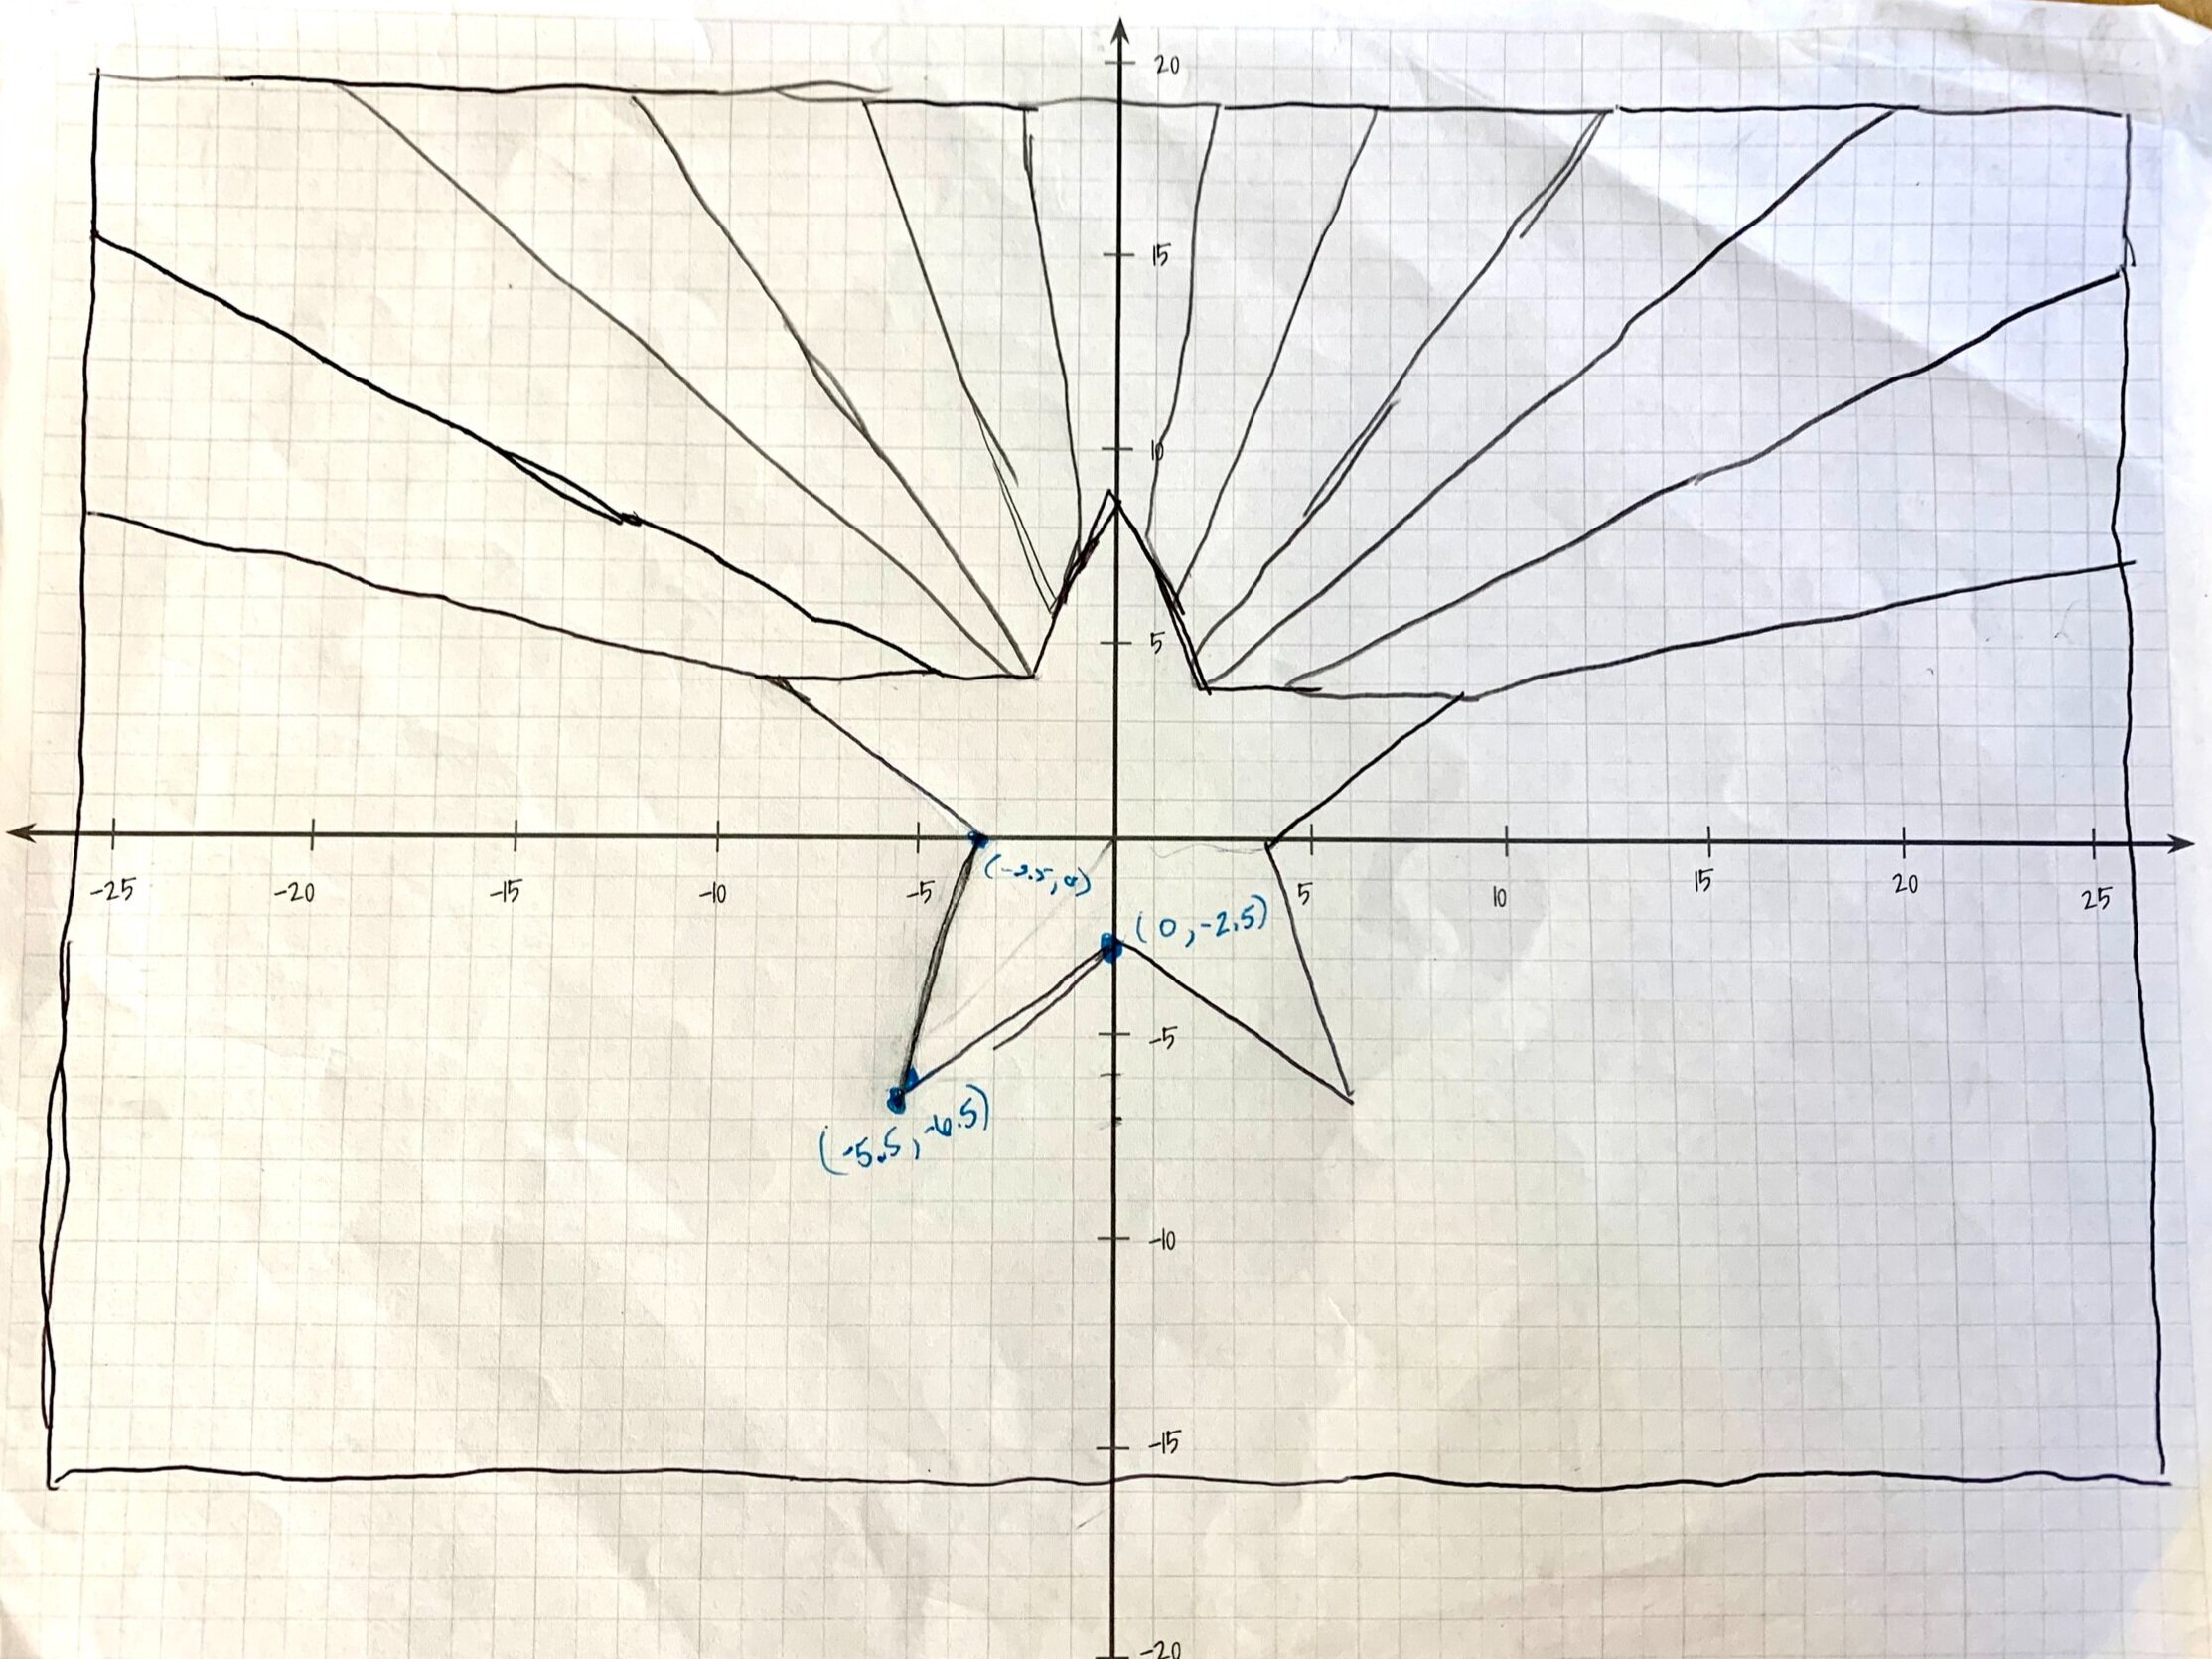
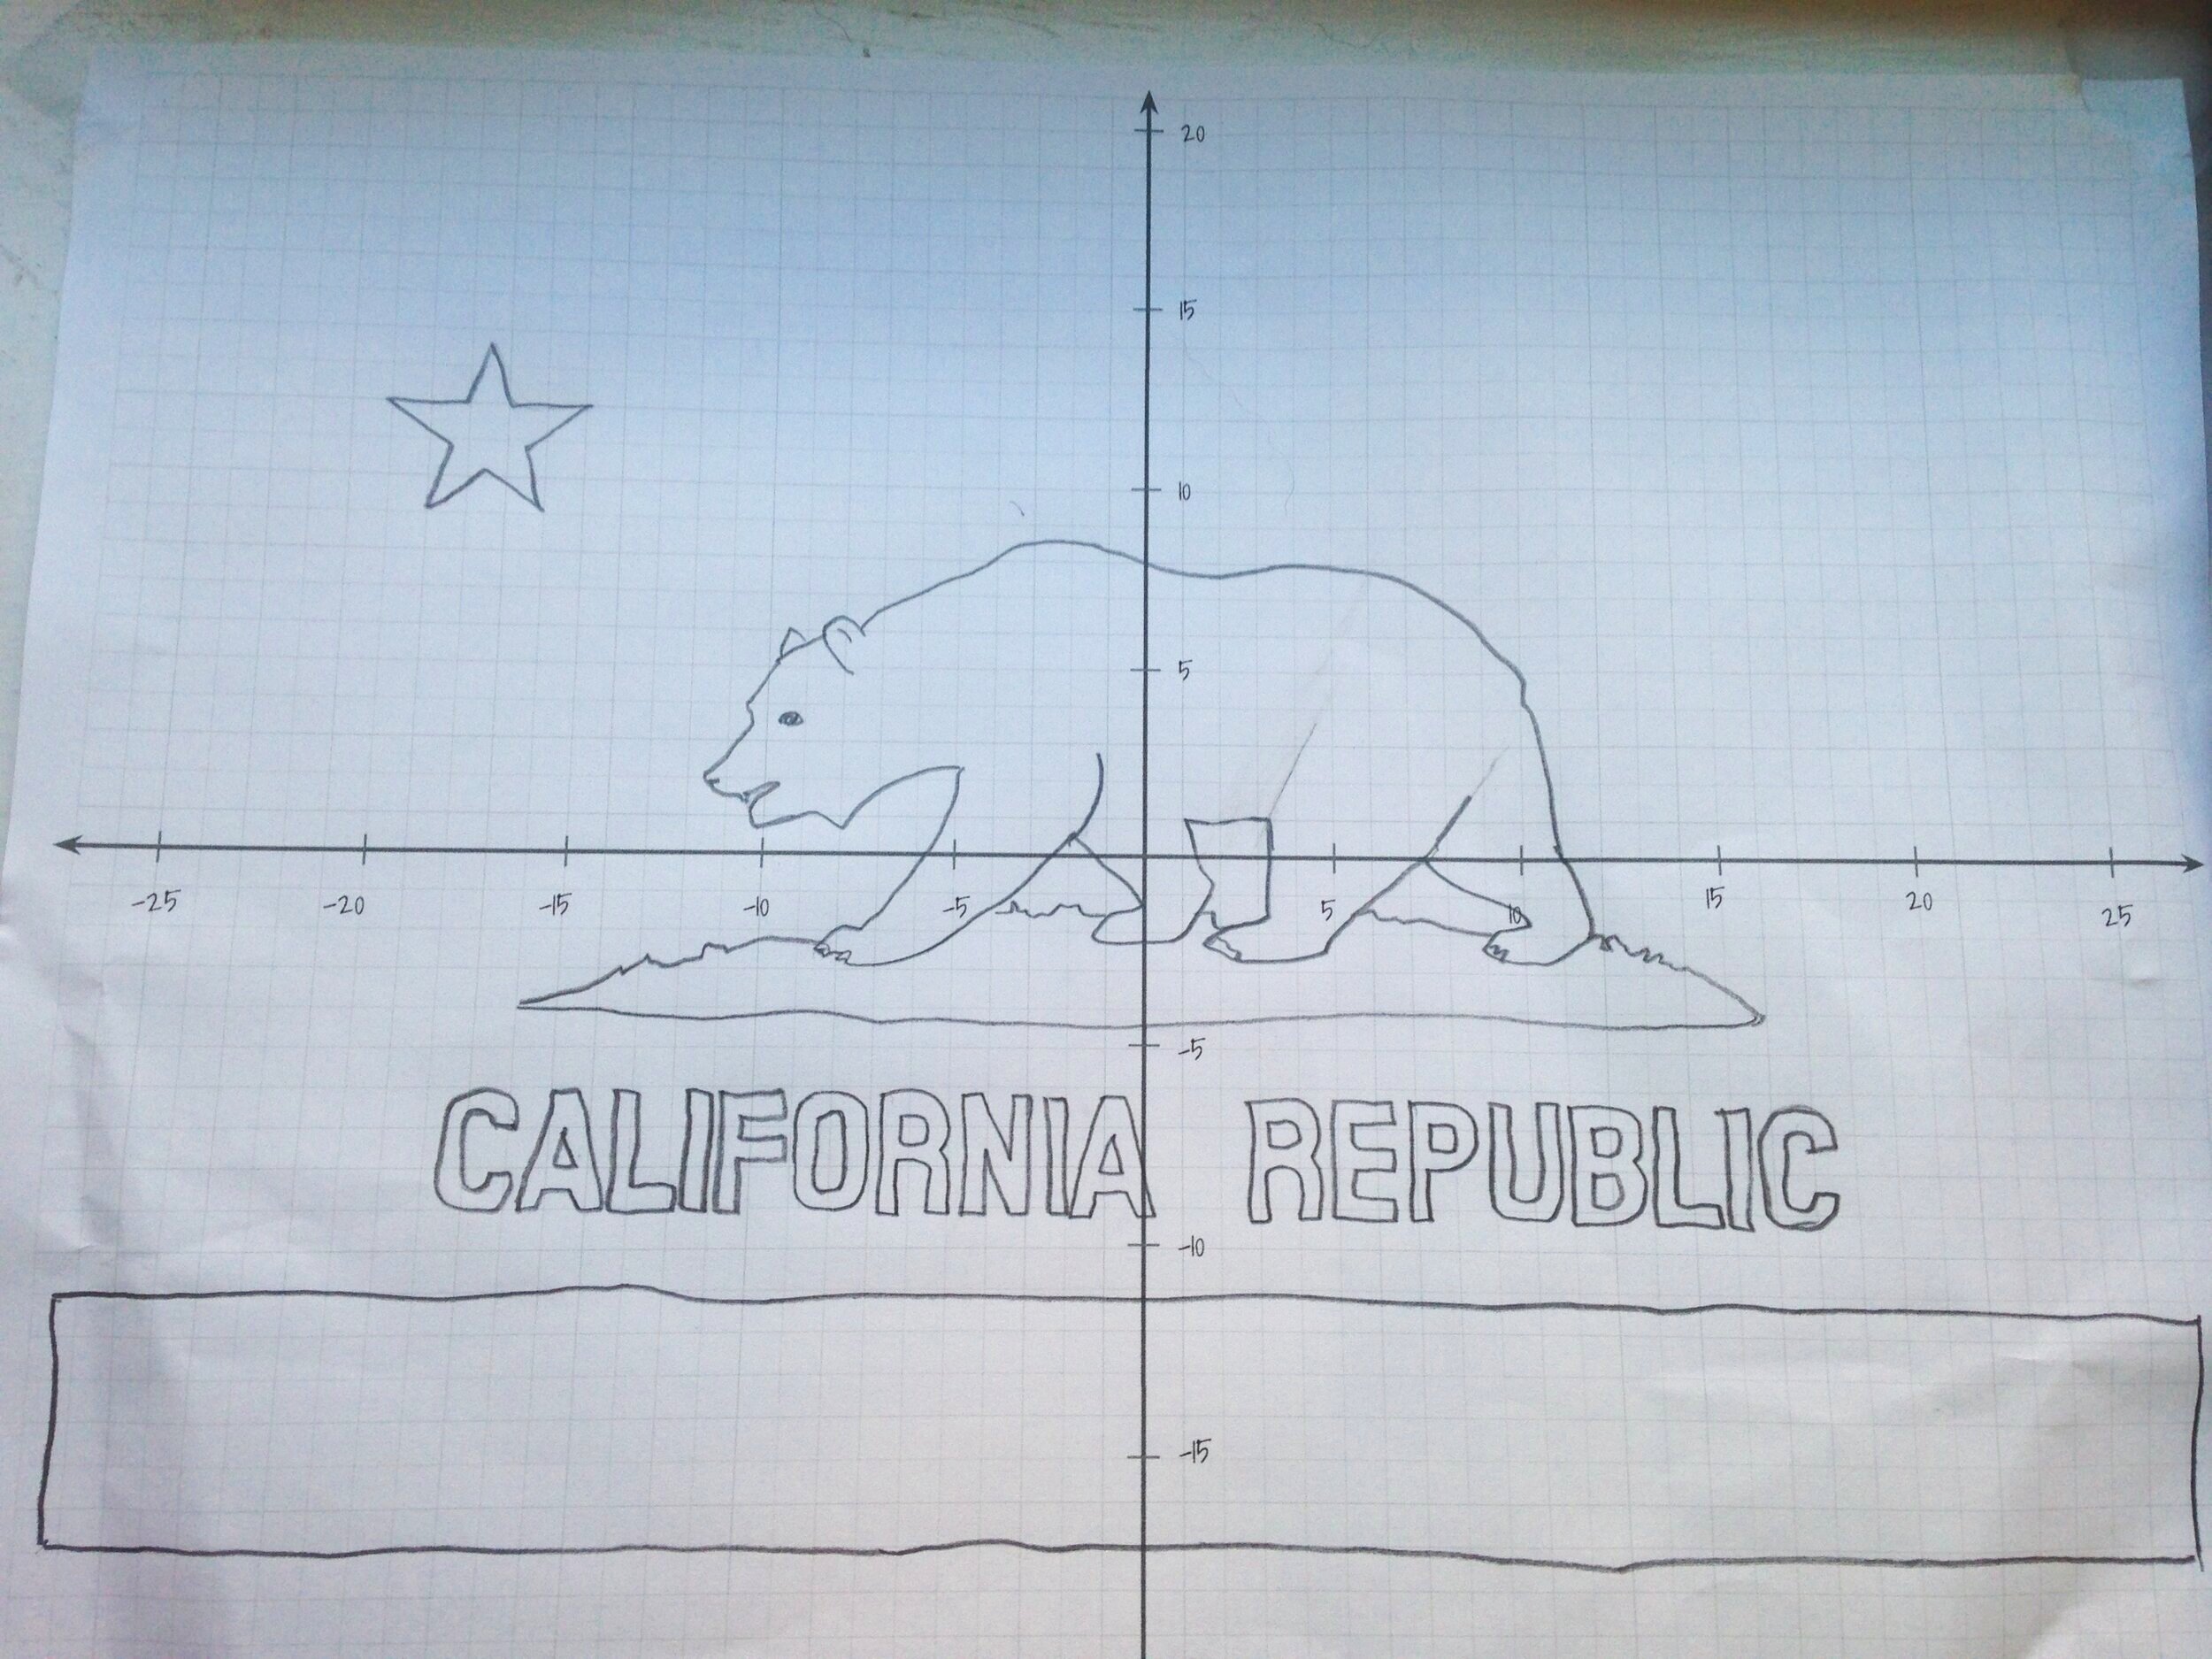
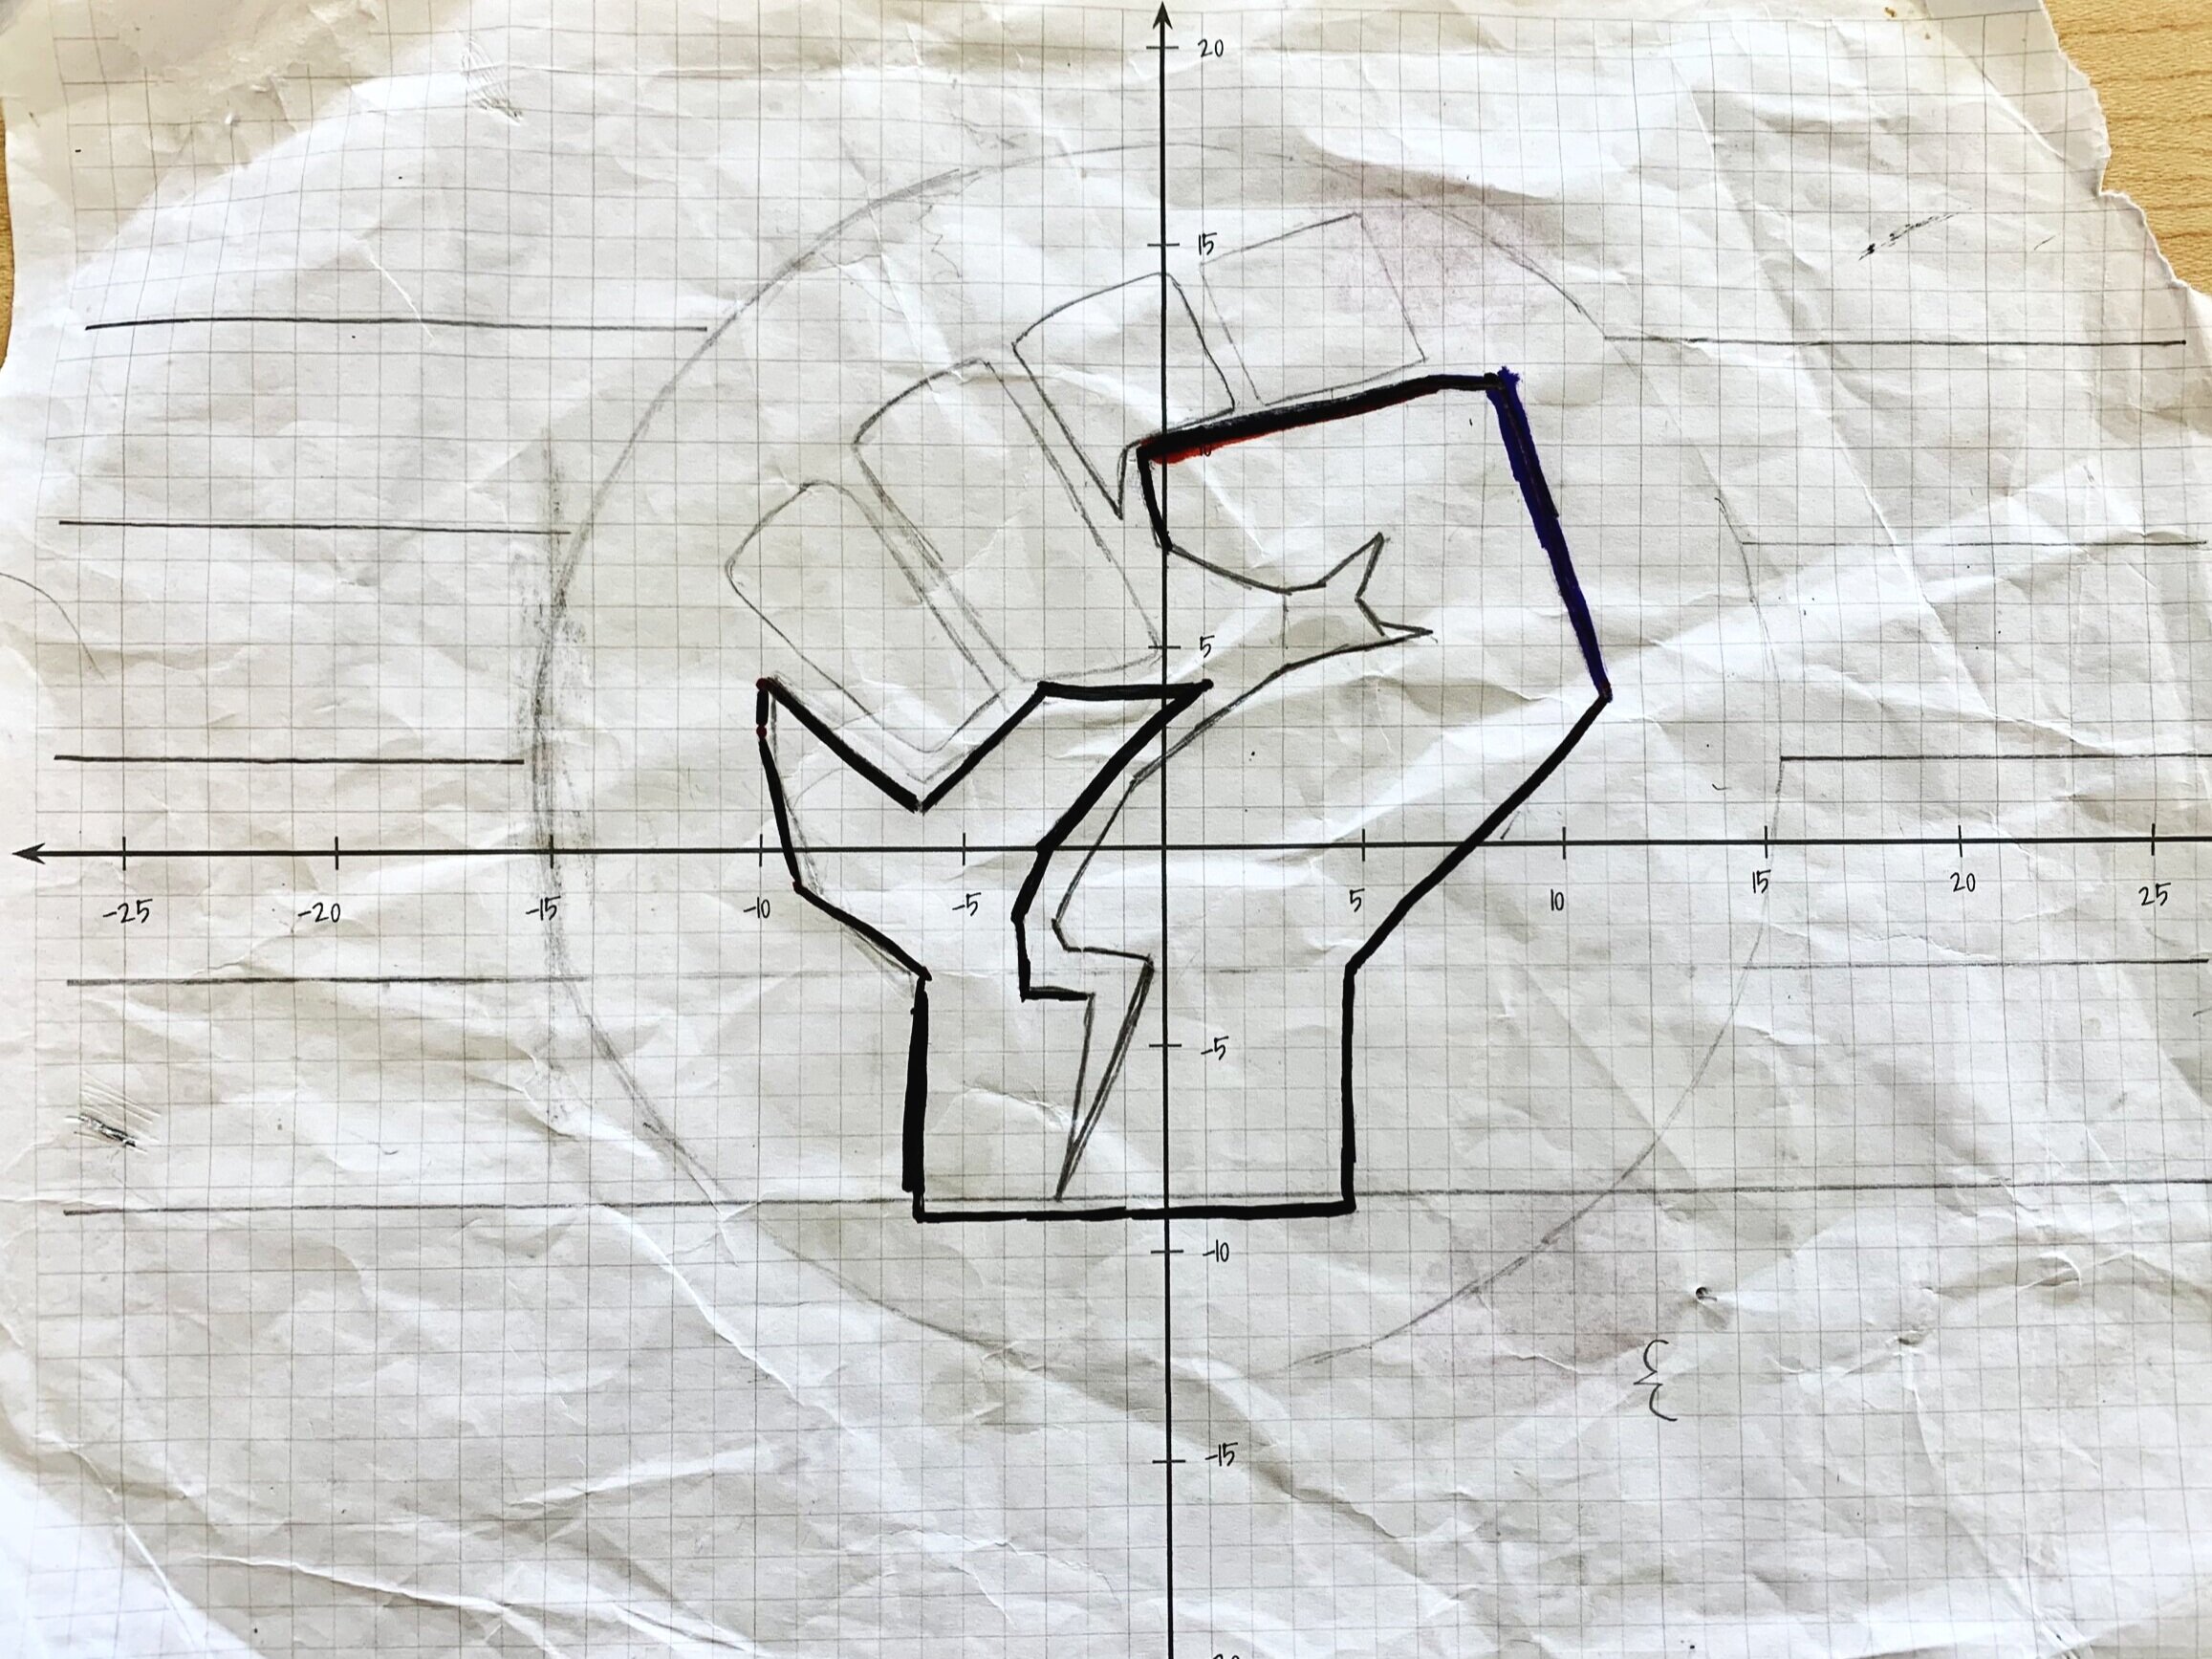
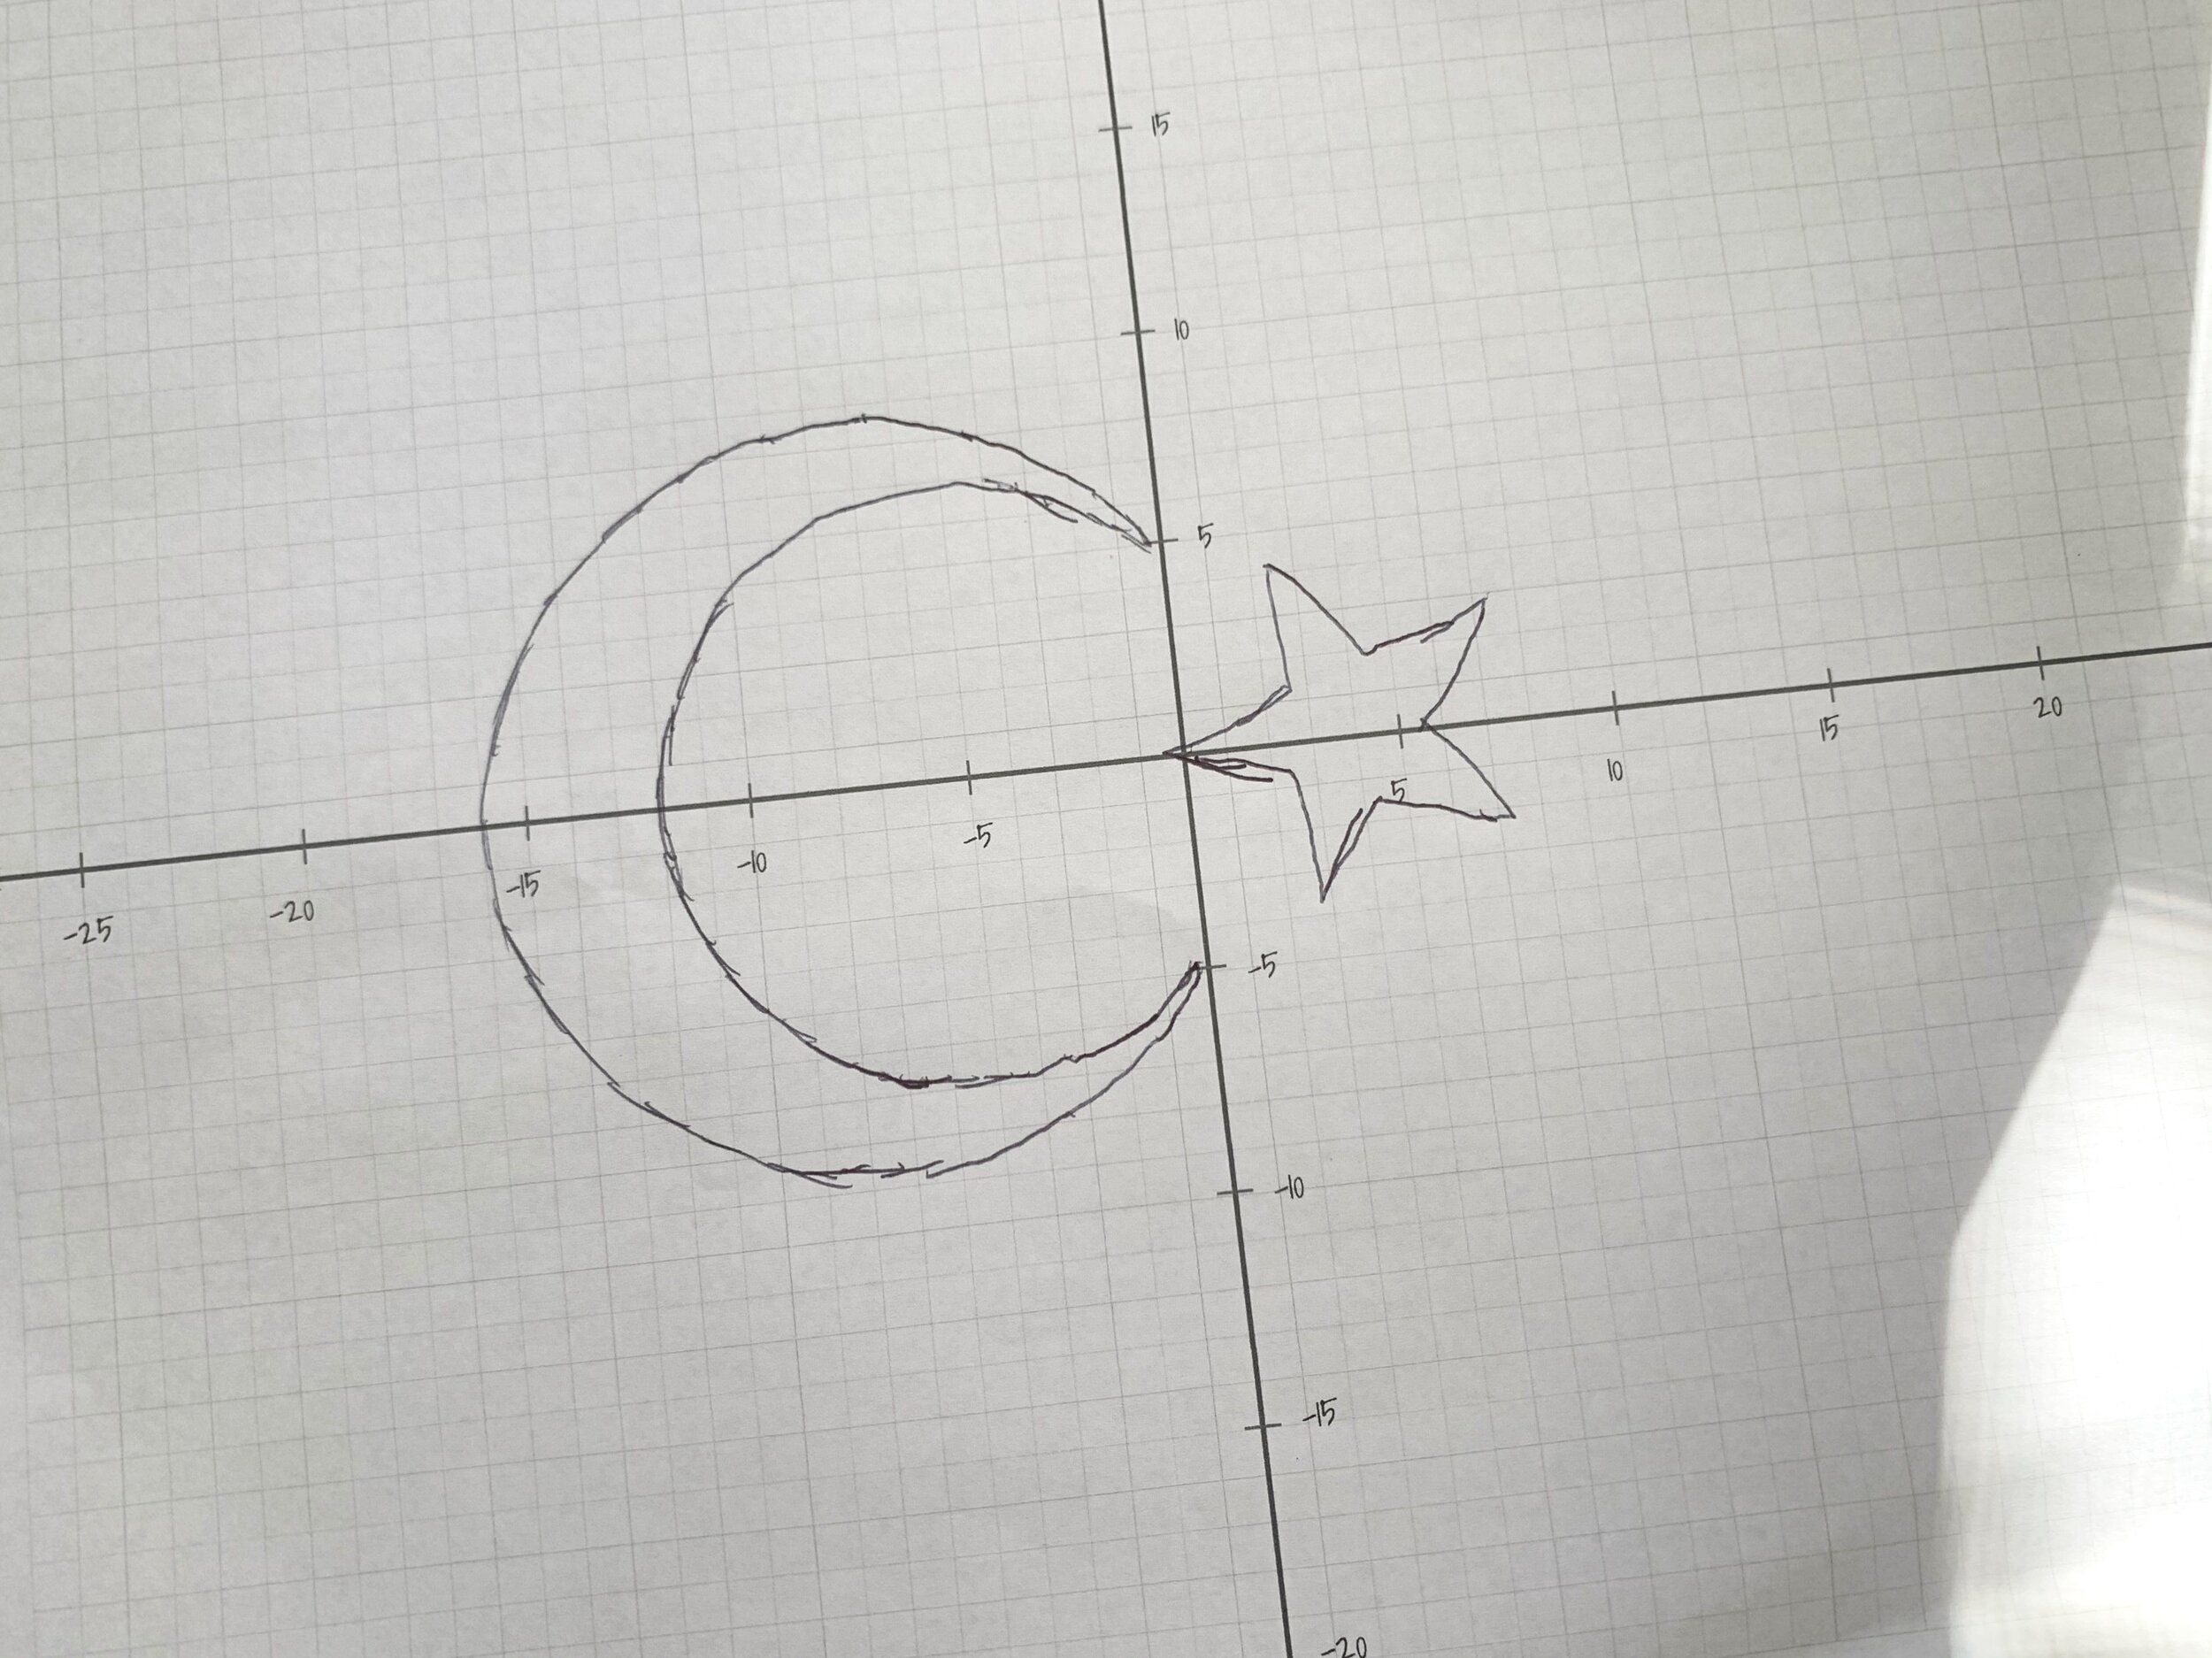
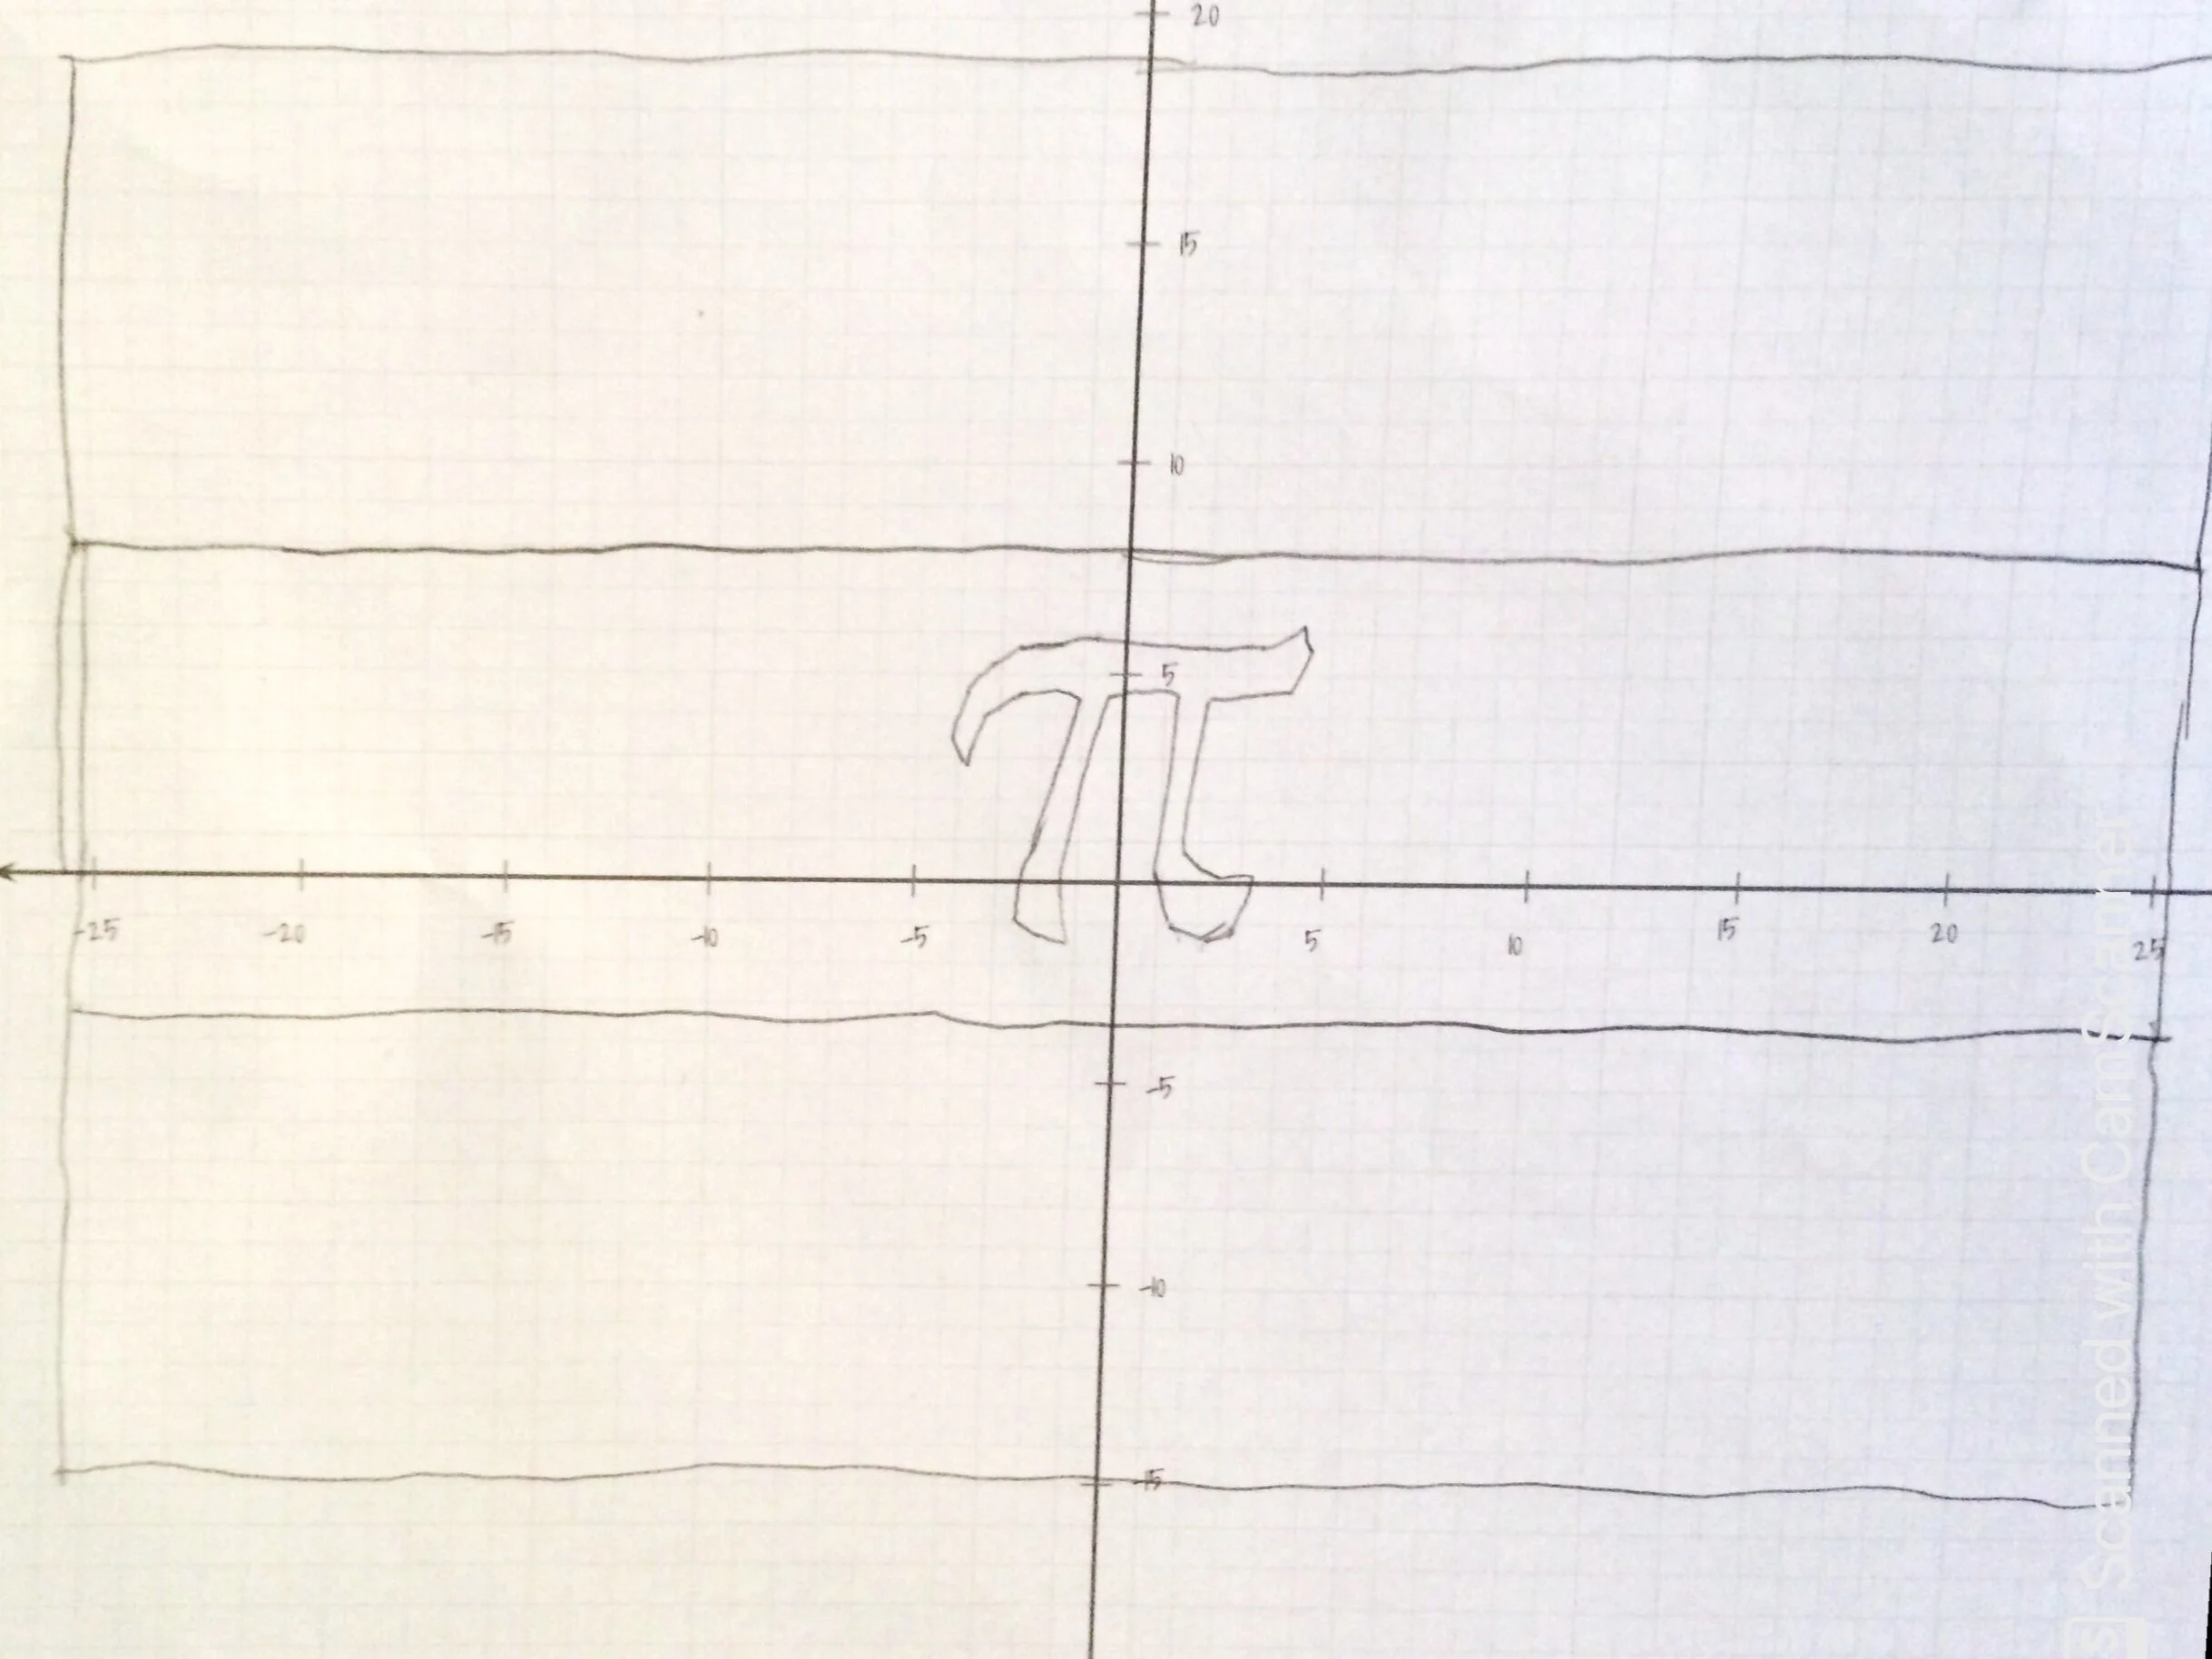
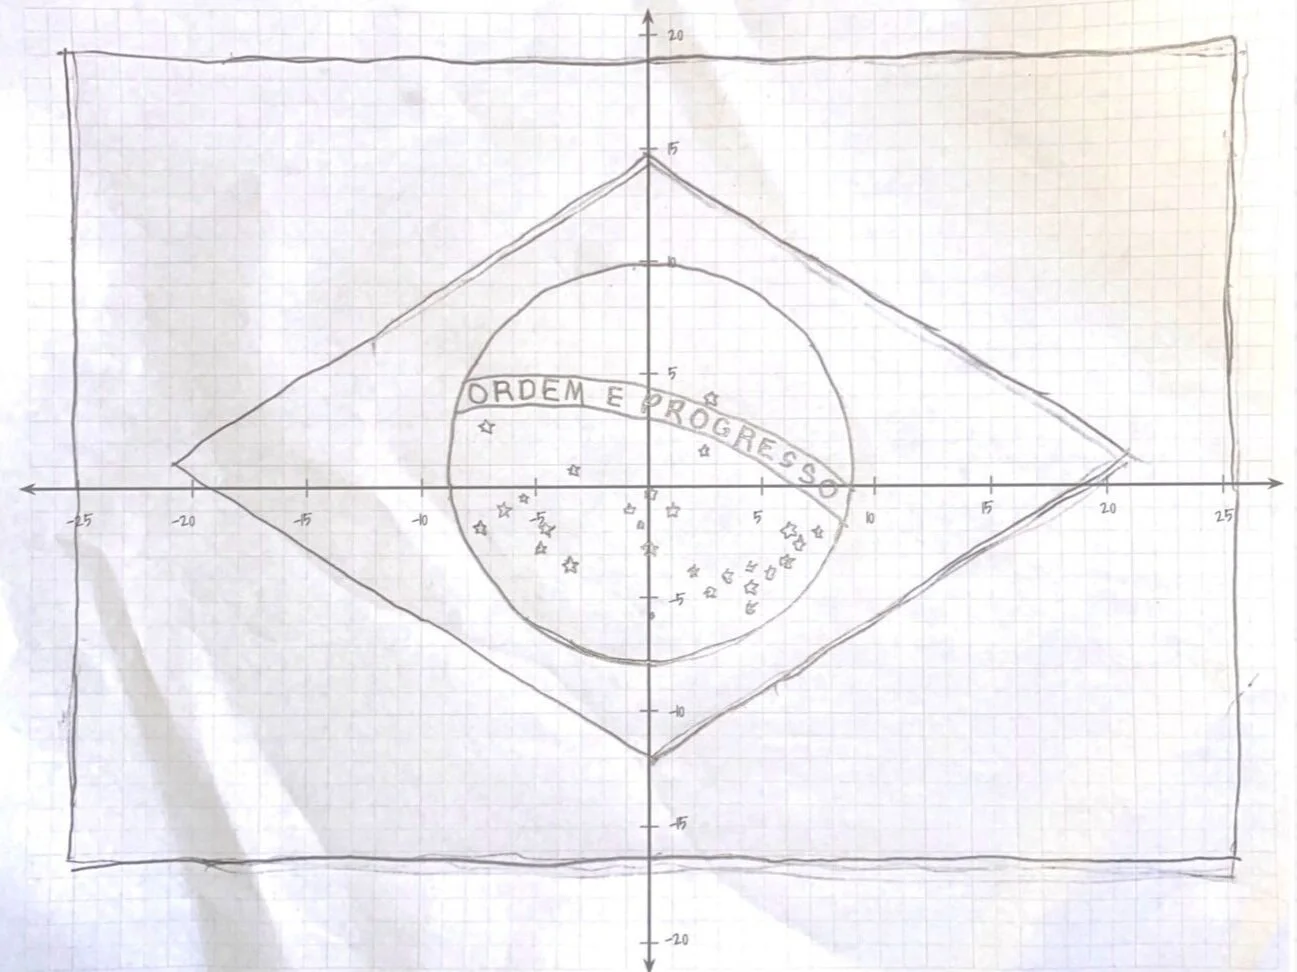
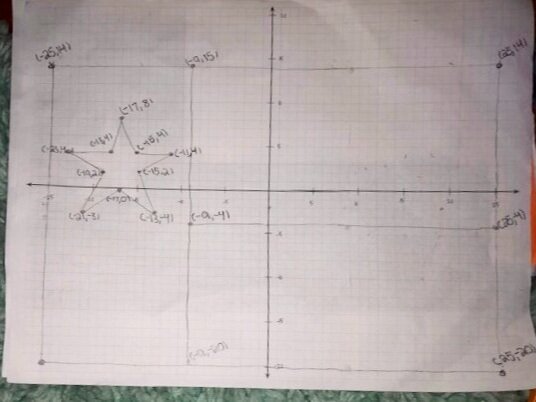
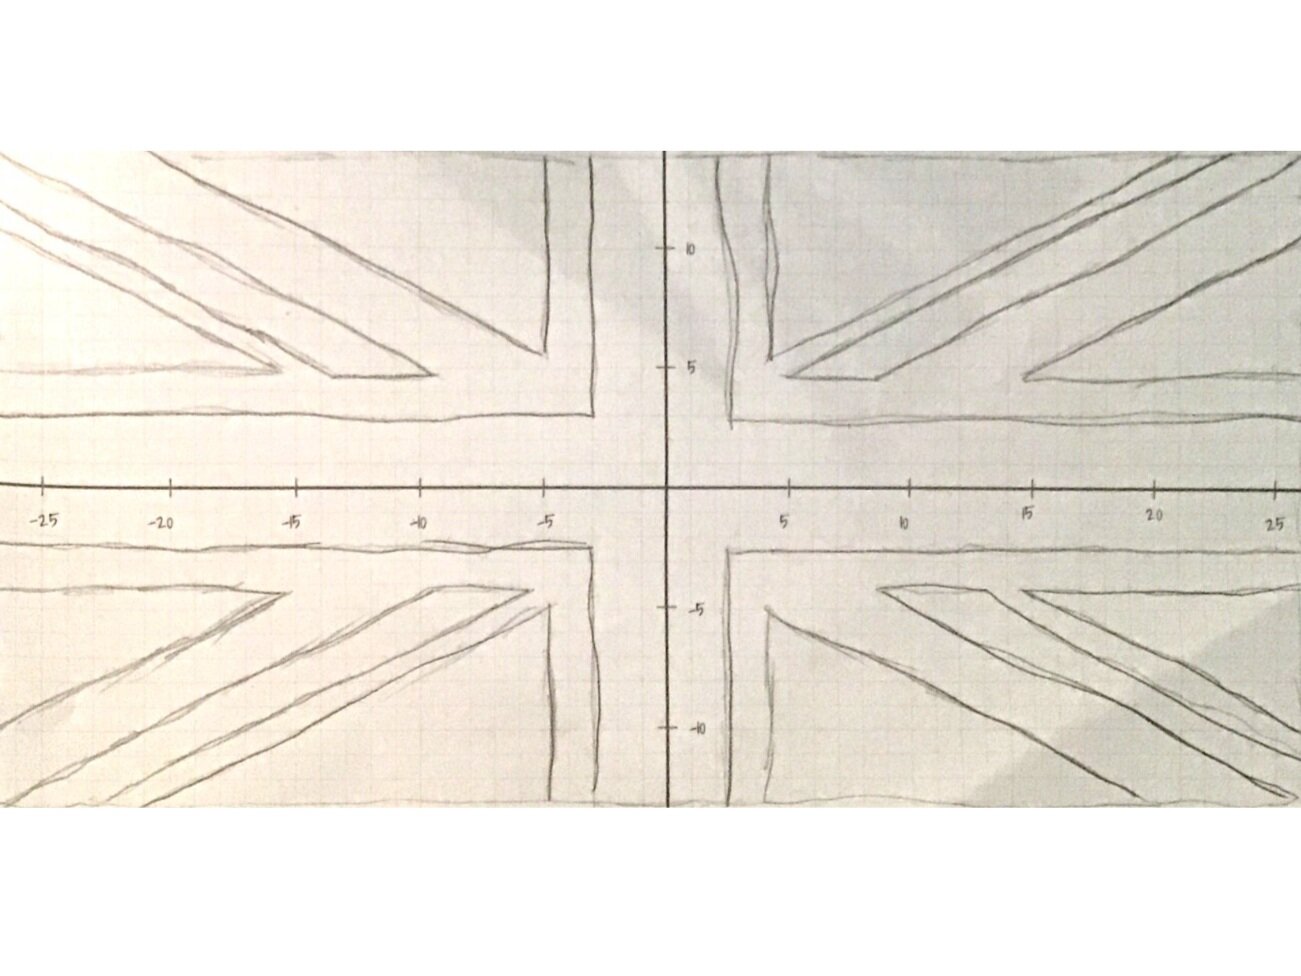
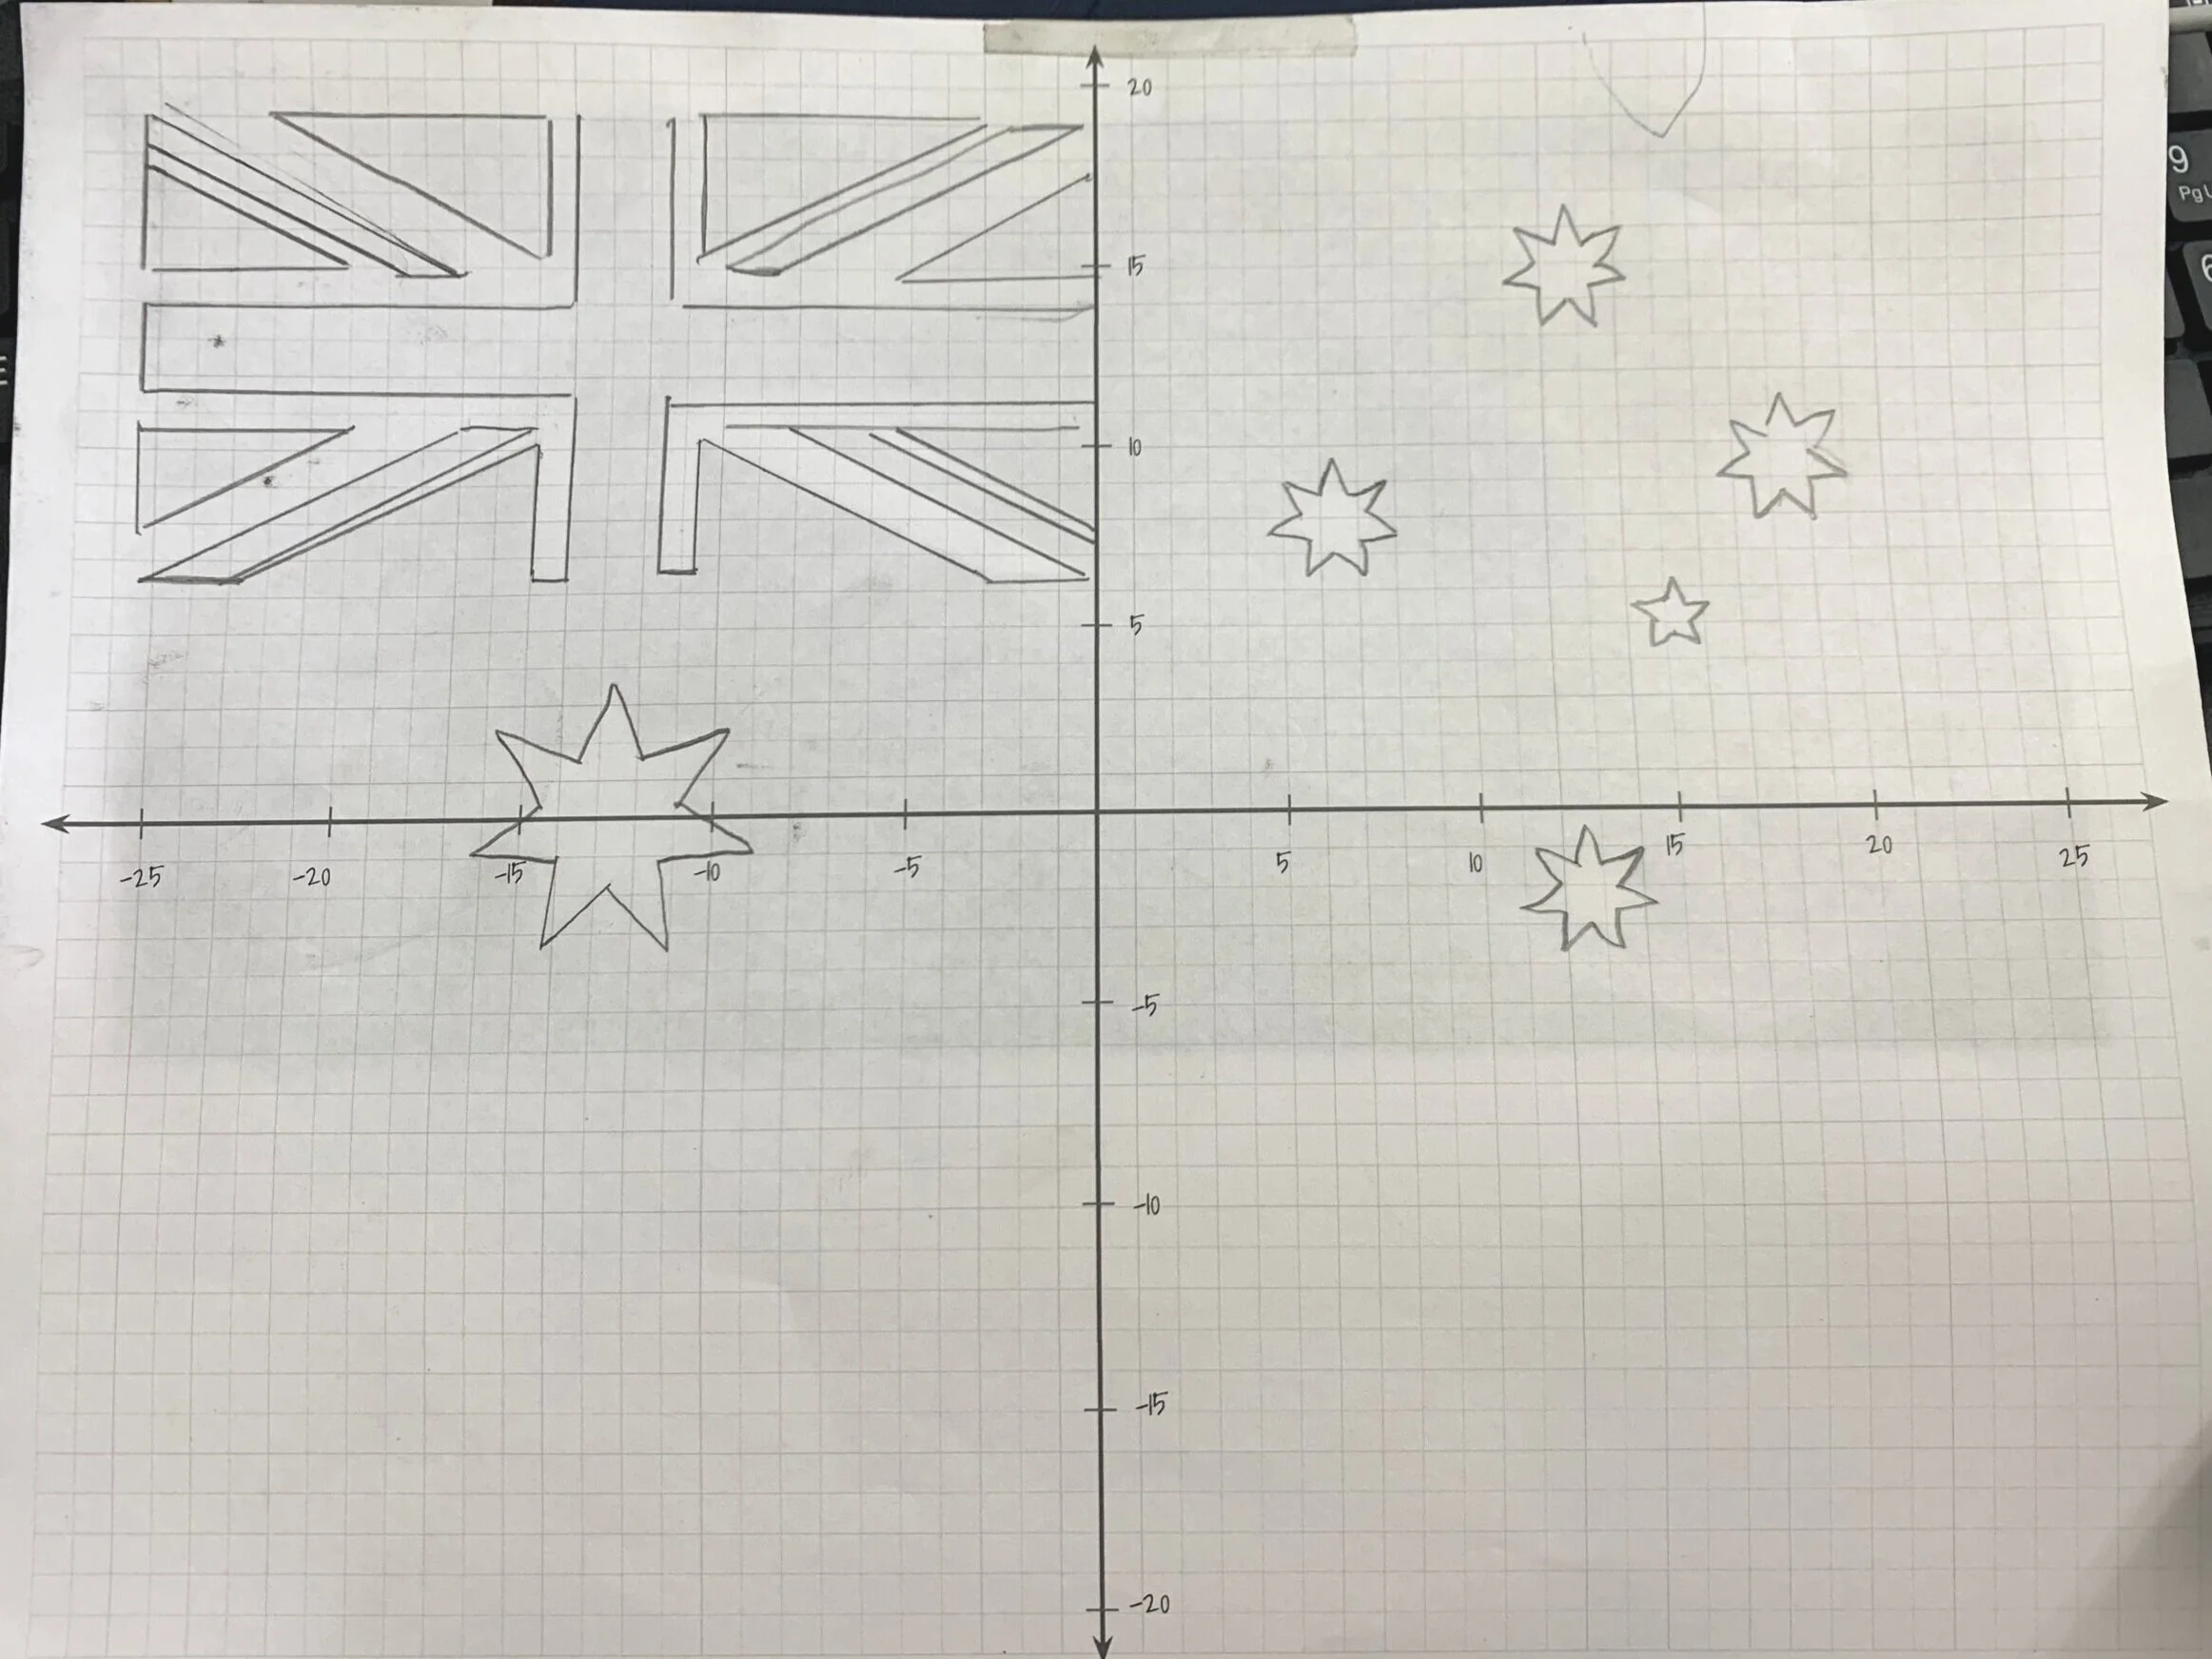
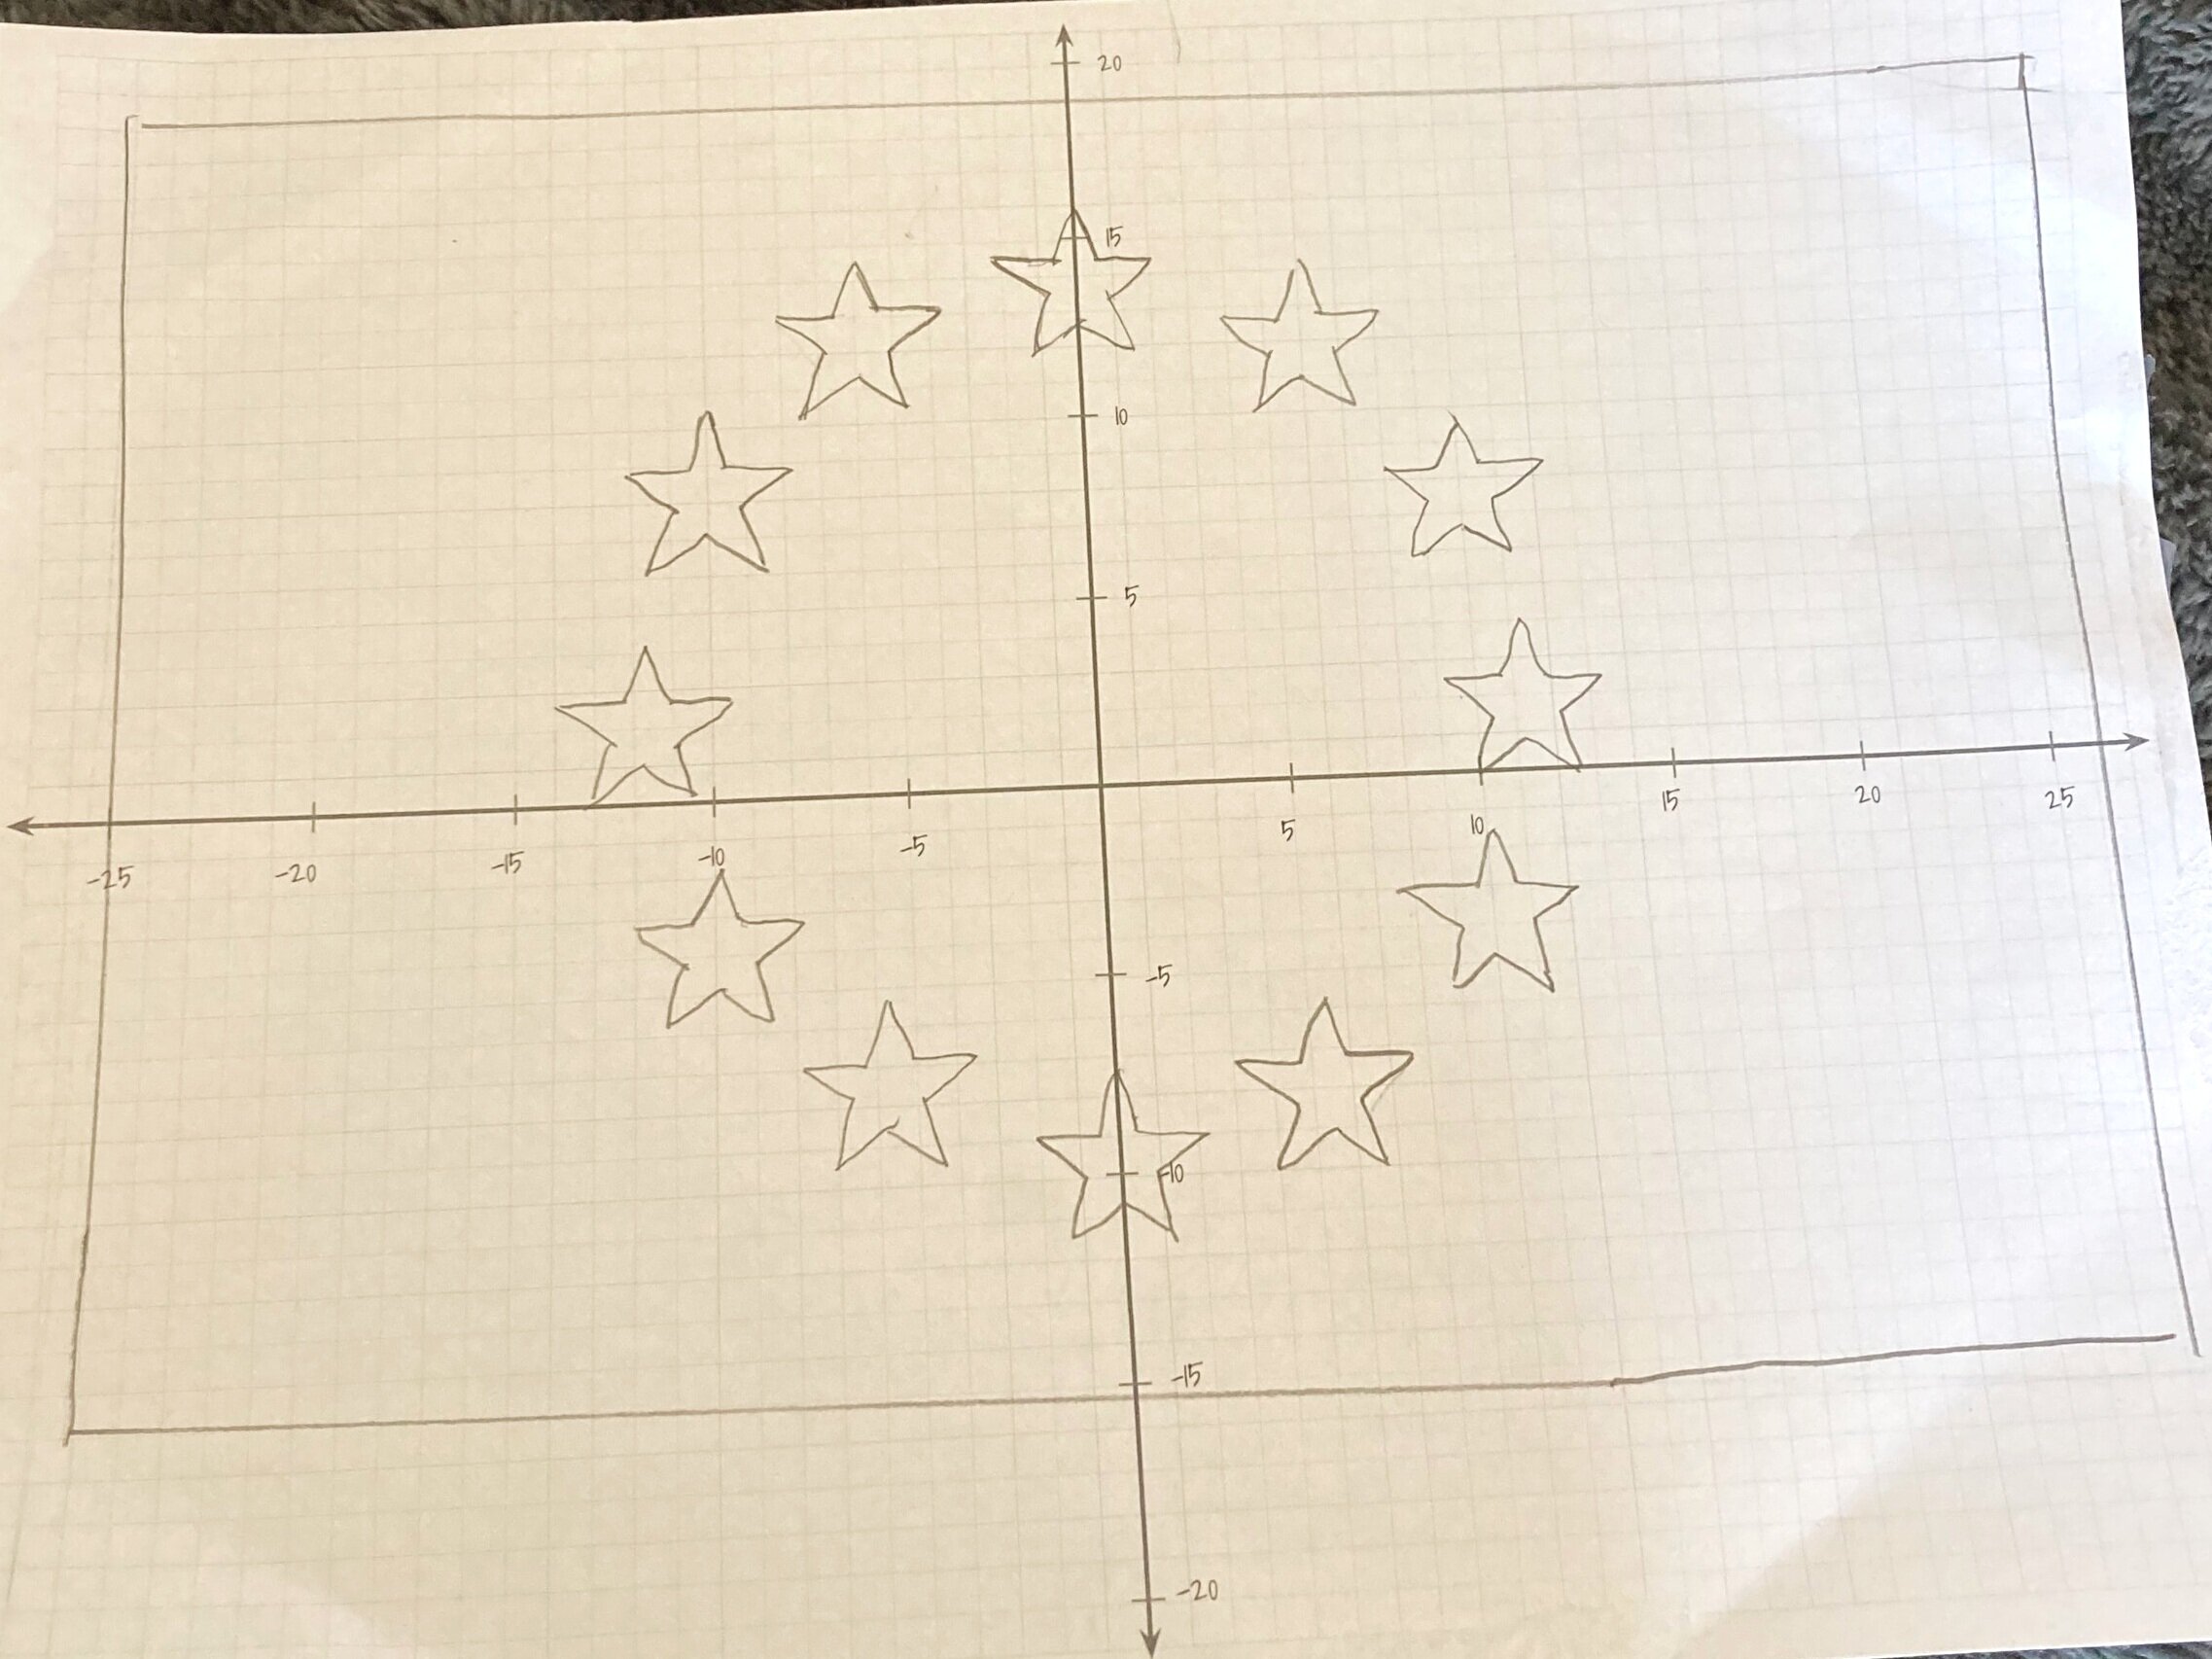
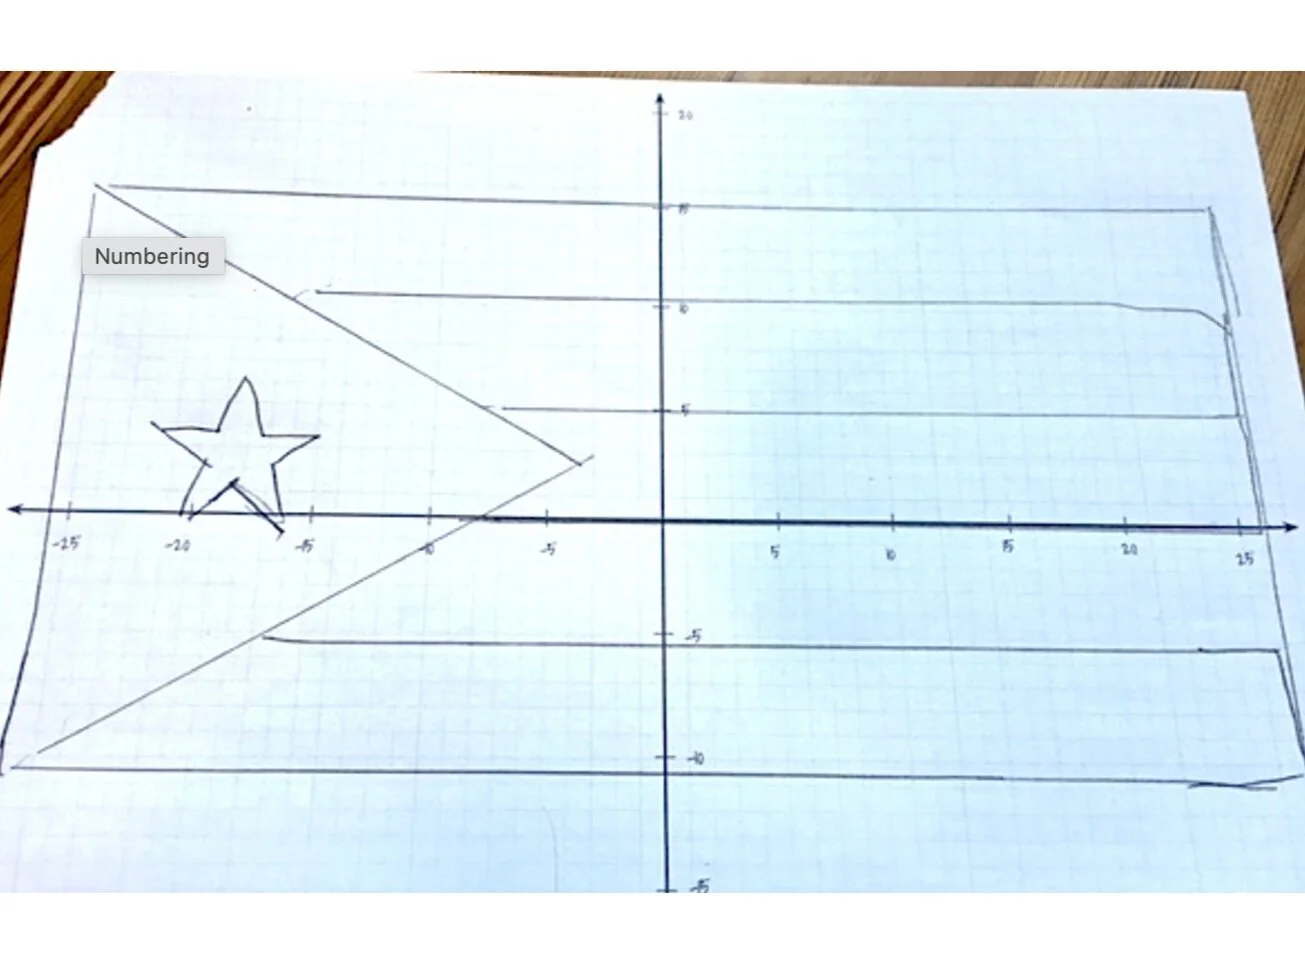
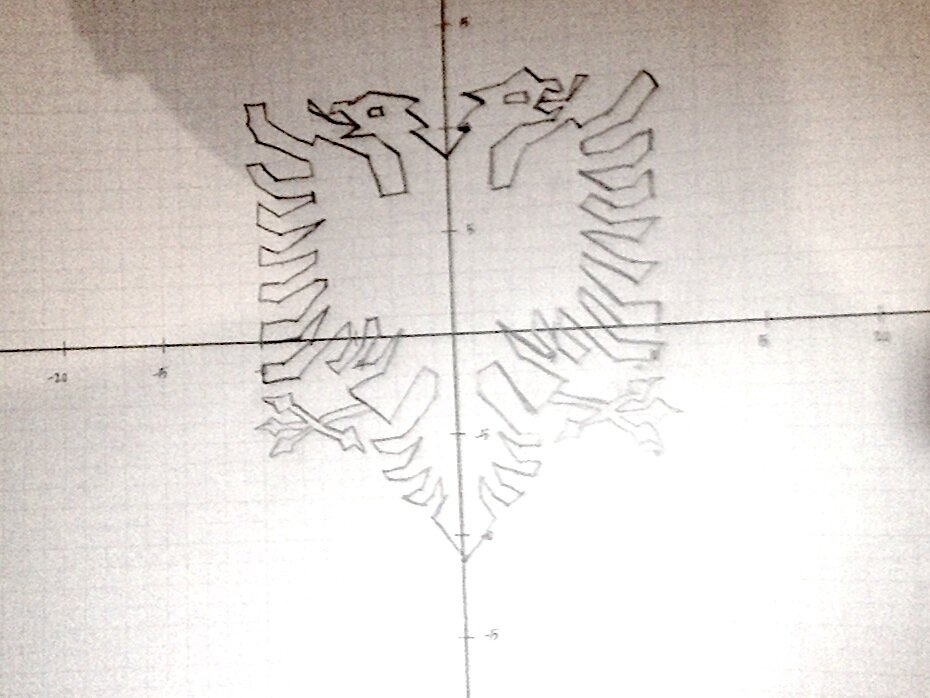
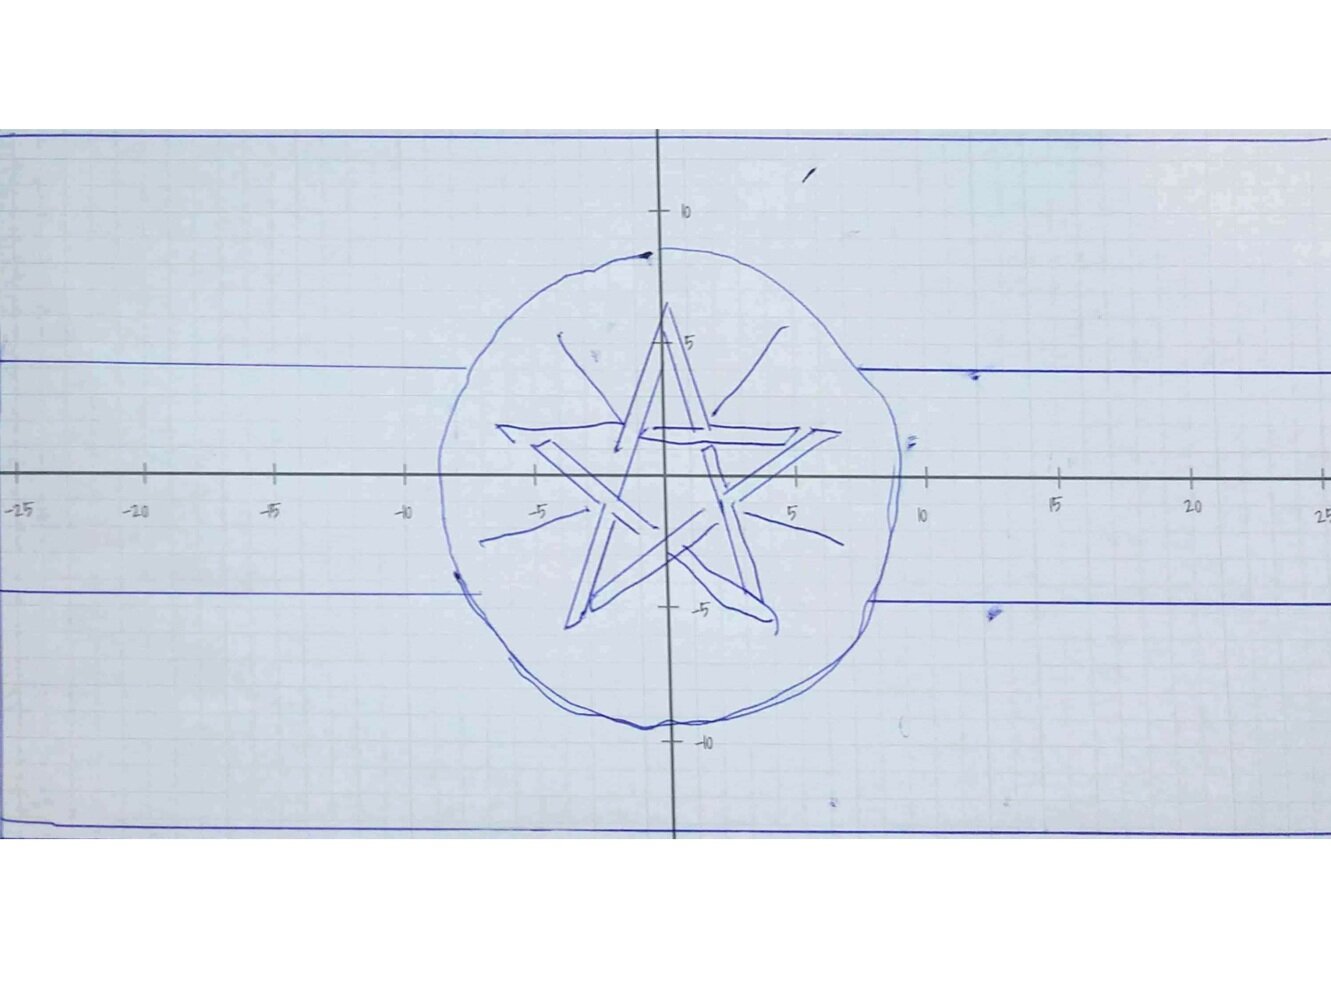
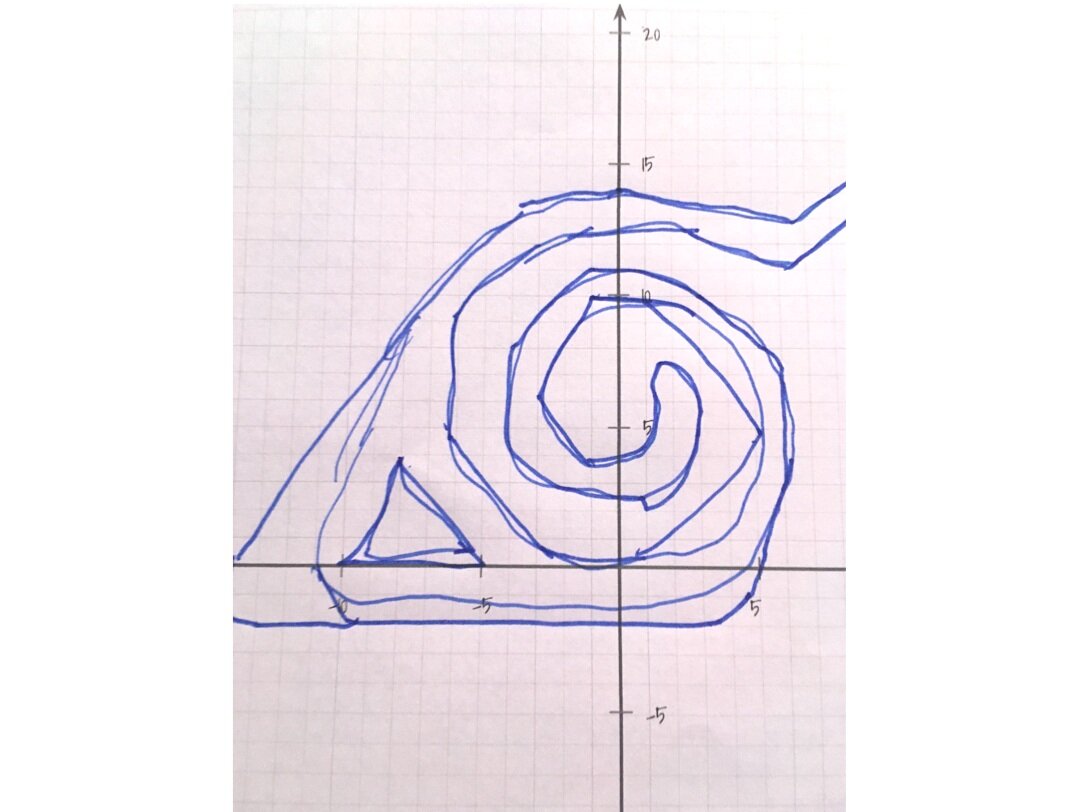
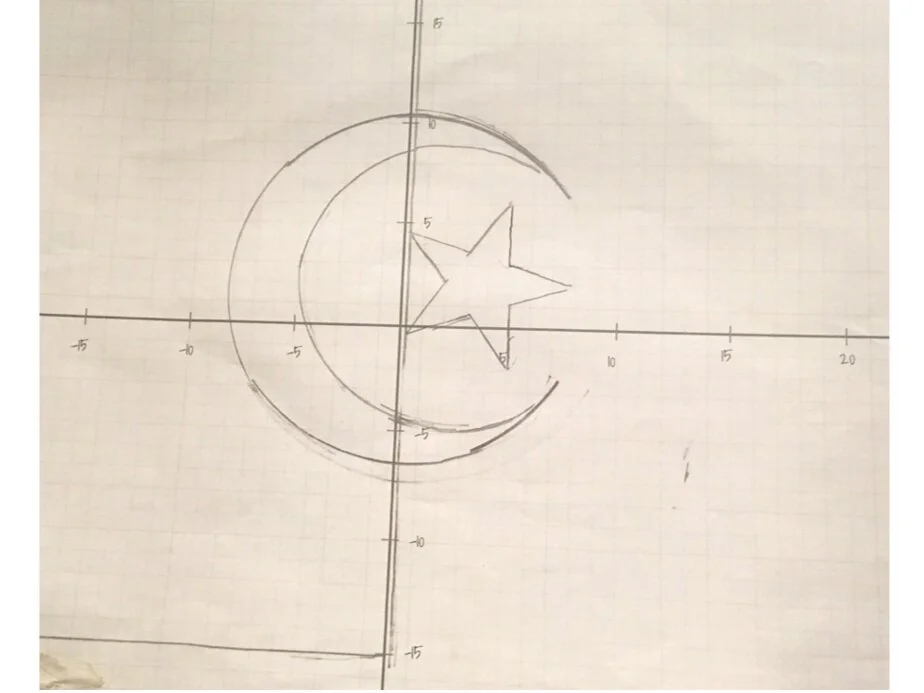
In order to finish this ambitious project, we first traced our flag onto a piece of graph paper using a makeshift lightbox (a.k.a window). This allowed us to better find the ordered pairs of each line segment. Then, starting with a single line, we solved for slope. To do this, using a formula that followed a pattern that we had noticed in class, we imputed our x and y values for each of the sides of our line segments. After we had found the slope of the line they were working on, we needed to find what y was equal to when x was equal to 0 (better known as y-intercept). We used the variables that we knew (x, y, and m) to solve for b using the equation y=mx+b (m being slope and b being y-intercept). After that, all we had to do was find the boundaries of the line segment.
After almost a month of work, we had all finished our flags! While some flags might seem simple, it is very hard to appreciate how complicated a mere line can be!
-Genesee, Division 1 student
Click on each completed flag below to go to the student’s Desmos page, and click on the sketches to see their work!